|
|
Post by jeffolie on Feb 20, 2016 11:37:52 GMT -6
|
|
|
|
Post by jeffolie on Feb 3, 2016 21:38:16 GMT -6
|
|
|
|
Post by jeffolie on Feb 1, 2016 4:33:39 GMT -6
|
|
|
|
Post by jeffolie on Jan 29, 2016 17:08:10 GMT -6
January 29, 2016 Who Owns a Gun? Despite all the talk about guns, only 32 percent of Americans have a gun in their home, according to the General Social Survey—a figure that has fallen over the past few decades (it was more than 50 percent in the early 1980s). Gun ownership is much more common among non-Hispanic Whites than Blacks or Hispanics... Percent of households with a gun Black households: 15% Hispanic households: 15% Non-Hispanic White households: 42% Source: Demo Memo analysis of the 2014 General Social Survey demomemo.blogspot.com/ |
|
|
|
Post by jeffolie on Jan 28, 2016 19:26:30 GMT -6
|
|
|
|
Post by jeffolie on Jan 28, 2016 19:21:01 GMT -6
|
|
|
|
Post by jeffolie on Jan 18, 2016 7:38:32 GMT -6
|
|
|
|
Post by jeffolie on Jan 18, 2016 7:28:12 GMT -6
Just 62 people own as much wealth as half the world’s population: Oxfam By Barbara Kollmeyer Published: Jan 18, 2016 The wealthiest have gained a half a trillion dollars in five years “Oxfam’s prediction — made ahead of last year’s Davos — that the 1% would soon own more than the rest of us by 2016, actually came true in 2015, a year early,” the nonprofit said in a statement. The wealth of those 62 one-percenters has risen by more than half-a-trillion dollars in the last five years, the report said. At the same time, the total owned by the poorest half has fallen by a trillion dollars. In monetary terms, that club of 62 has seen its riches climb by $542 billion, or 44%, to $1.76 trillion since 2010. That’s as the less-fortunate half has seen its wealth slide by 41%. “Power and privilege are being used to rig the system to increase the gap between the richest and the rest to levels we have not seen before. Far from trickling down, income and wealth are instead being sucked upwards at an alarming rate,” said Raymond C. Offenheiser, president of Oxfam America, in a statement. Some other factoids in the Oxfam report: the daily income of the poorest 10% worldwide has risen by less than a cent every year, and their annual income has risen by less than $3 each year for the past quarter century. With the report, Oxfam is urging world’s leaders make a big initiative to tackle tax havens. Its release comes as the financial and political elites gather in Switzerland for the World Economic Forum, which begins in earnest on Wednesday in Davos. “Globally, it is estimated that a total of $7.6 trillion of individual’s wealth sits offshore — a 12th of the total. If tax would be paid on the income that this wealth generates, an extra $190 billion would be available to governments every year,” Oxfam said in the report. The nonprofit also highlighted that 9 out of 10 of this year’s World Economic Forum corporate partners have a presence in at least one tax haven. It estimates that tax dodging by multinational corporations comes at a cost to developing countries of least $100 billion every year. Corporate investment in tax havens almost quadrupled between 2000 and 2014, according to Oxfam. It took a final jab at wage inequality in the U.S., noting that salaries of chief executive officers at top companies have risen by half since 2009, but the minimum wage has been stuck at $7.25. That’s even as the cost of groceries has shot up 25%, Oxfam noted. “Given that a solid majority of voters across all political backgrounds support an increase, it seems an obvious thing to do, but Congress isn’t budging,” said Offenheiser. www.marketwatch.com/story/just-62-people-own-as-much-wealth-as-half-the-worlds-population-oxfam-2016-01-18?link=MW_home_latest_news |
|
|
|
Post by jeffolie on Jan 17, 2016 19:11:33 GMT -6
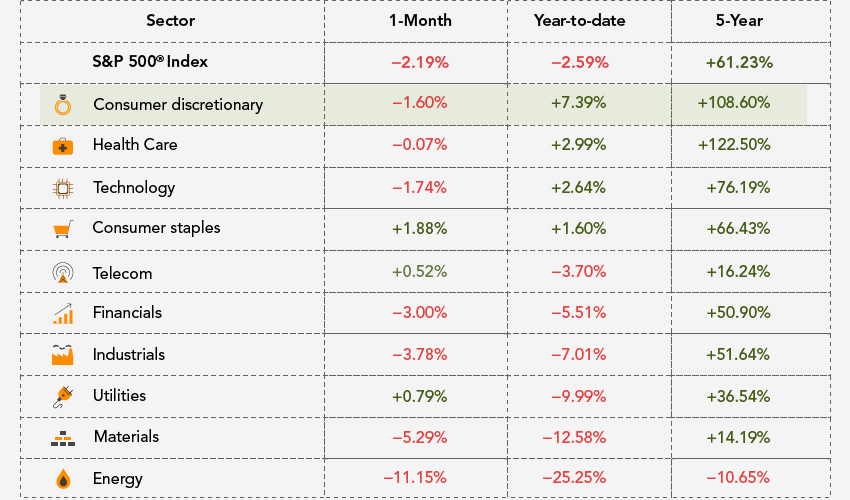
16 Jan 2016 07:34 PM PST In week two of the new year, the eight indexes our world watch list continued their selloff. The top performer over the previous week was the UK's FTSE 100, down only 1.83%. The biggest loser is China's Shanghai Composite, down 8.96% this week, which (bizarrely enough) is an improvement over its 9.97% plunge the first week of the new year. Are we seeing a global bear market? Consider this: Since their 2015 highs, four of the eight are down more than 20%: The Shanghai at -48.3%, the Hang Seng at -31.4%, the DAX at -24.4% and the CAC 40 at 20.1%. The FTSE and SENSEX are not far behind. www.advisorperspectives.com/dshort/updates/World-Market-Snapshot?utm_source=dshort_feed&utm_medium=rss&utm_campaign=item_link |
|
|
|
Post by jeffolie on Jan 15, 2016 16:55:05 GMT -6
|
|
|
|
Post by jeffolie on Jan 15, 2016 15:53:26 GMT -6
U.S. stocks ended the day with sharp losses Friday, posting the worst 10-day start to a year in history. A combination of plunging crude-oil prices CLG6, -4.87% and worries about slowing growth in the U.S. and China unsettled investors. Stocks trimmed their losses in the last hour of trading, but remained sharply lower. The S&P 500 SPX, -2.16% closed 45 points, or 2.3%, lower at 1,876, with financials, information technology and energy leading the losses. The Dow Jones Industrial Average DJIA, -2.39% fell 392 points, or 2.4%, to 15,987. Intel INTC, +0.24% led the Dow industrials lower, down more than 9%. Meanwhile, the Nasdaq Composite COMP, -2.74% ended the day down 127 points, or 2.7%, at 4,488. www.marketwatch.com/story/us-stocks-post-worst-10-day-calendar-start-in-history-2016-01-15?dist=afterbell |
|
|
|
Post by jeffolie on Jan 14, 2016 16:36:38 GMT -6
|
|
|
|
Post by jeffolie on Jan 11, 2016 17:03:00 GMT -6
|
|
|
|
Post by jeffolie on Jan 7, 2016 17:41:56 GMT -6
For the first four trading days of 2016, the DJIA is down 911 points. 911.. 911... 911!!!
Get your tinfoil hats here!!! Get your tinfoil hats here!!!
|
|
|
|
Post by jeffolie on Jan 7, 2016 17:27:15 GMT -6
|
|
|
|
Post by jeffolie on Jan 4, 2016 16:33:20 GMT -6
|
|
|
|
Post by jeffolie on Dec 30, 2015 6:16:30 GMT -6
Global economic growth will be "disappointing and uneven" next year, the head of the International Monetary Fund said in a guest article for German newspaper Handelsblatt. "In many countries the financial sector still has weaknesses and in emerging markets the financial risks are increasing," IMF Managing Director Christine Lagarde declared. She added that low productivity, aging populations, a decline in raw materials, and the effects of financial crises were putting the brakes on a global expansion. seekingalpha.com/news/3007176-lagarde-global-growth-will-be-disappointing-in-2016?ifp=0 |
|
|
|
Post by jeffolie on Dec 30, 2015 5:25:02 GMT -6
|
|
|
|
Post by jeffolie on Dec 30, 2015 5:07:29 GMT -6
 www.chartoftheday.com/20151230.gif www.chartoftheday.com/20151230.gifChart of the Day With the 2016 presidential campaign now in full swing, today's chart illustrates how the stock market has performed during the average election year. Since 1900, the first five months of the election year have tended to be choppy. That choppiness was then followed with a rally right up to the November election. One theory to support this election year stock market behavior is that the first five months of choppiness is due in part to the uncertainty of the outcome of the presidential election (the market abhors uncertainty) with the market beginning to rally as the outcome of the election becomes increasingly evident. www.chartoftheday.com/20151230.htm?H |
|
|
|
Post by jeffolie on Dec 26, 2015 15:49:43 GMT -6
|
|
|
|
Post by jeffolie on Dec 25, 2015 10:44:13 GMT -6
|
|
|
|
Post by jeffolie on Dec 24, 2015 15:59:46 GMT -6
December 24, 2015
Uptick in the Tchotchke Index
The Tchotchke Index ticked up in 2014, with average household spending on gift shop items, home decor trinkets, and yard sale finds rising to $111. The rise in the index is a positive economic indicator. The more we're willing to spend on tchotchkes, the greater our economic well-being. Demo Memo Blog created the Tchotchke Index several years ago to track consumer confidence (here is the original post). It's the amount of money spent by the average household on "decorative items for the home," a category in the Consumer Expenditure Survey.
The Tchotchke index remains well below its peak. In 2000, the average household spent $263 (in 2014 dollars) on decorative items for the home. Spending plunged during the recession of the early 2000s, struggled to reach $236 in 2005, then plummeted during the Great Recession. The index hit an all-time low of $104 in 2013...
Tchotchke Index (in 2014 dollars)
2014: $111
2013: $104
2012: $131
2011: $123
2010: $110
2009: $142
2008: $139
2007: $177
2006: $166
2005: $236
2004: $208
2003: $168
2002: $198
2001: $202
2000: $263
Source: Demo Memo analysis of the Consumer Expenditure Survey
|
|
|
|
Post by jeffolie on Dec 22, 2015 16:53:27 GMT -6
|
|
|
|
Post by jeffolie on Dec 13, 2015 15:00:49 GMT -6
Happiness Doesn’t Bring Good Health, Study Finds By DENISE GRADYDEC. 9, 2015 Go ahead and sulk. Unhappiness won’t kill you. A study published on Wednesday in The Lancet, following one million middle-aged women in Britain for 10 years, finds that the widely held view that happiness enhances health and longevity is unfounded. “Happiness and related measures of well-being do not appear to have any direct effect on mortality,” the researchers concluded. “Good news for the grumpy” is one way to interpret the findings, said Sir Richard Peto, an author of the study and a professor of medical statistics and epidemiology at the University of Oxford. He and his fellow researchers decided to look into the subject because, he said, there is a widespread belief that stress and unhappiness cause disease. Such beliefs can fuel a tendency to blame the sick for bringing ailments on themselves by being negative, and to warn the well to cheer up or else. “Believing things that aren’t true isn’t a good idea,” Professor Peto said in an interview. “There are enough scare stories about health.” “Good news for the grumpy,” said Sir Richard Peto, one of the authors of a study of one million middle-aged women in Britain for 10 years published Wednesday. Credit Tom Jamieson for The New York Times The new study says earlier research confused cause and effect, suggesting that unhappiness made people ill when it is actually the other way around. The results come from the so-called Million Women Study, which recruited women ages 50 to 69 from 1996 to 2001, and tracked them with questionnaires and official records of deaths and hospital admissions. The questionnaires asked how often the women felt happy, in control, relaxed and stressed, and also instructed them to rate their health and list ailments like high blood pressure, diabetes, asthma, arthritis and depression or anxiety. The researchers included questions about happiness “because it’s something a lot of people were interested in,” Professor Peto said. When the answers were analyzed statistically, unhappiness and stress were not associated with an increased risk of death. It is not clear whether the findings apply to men. Professor Peto said particularly important data came from 500,000 women who reported on their baseline surveys that they were in good health, with no history of heart disease, cancer, stroke or emphysema. A “substantial minority” of these healthy women said they were stressed or unhappy, he said, but over the next decade they were no more likely to die than were the women who were generally happy. “This finding refutes the large effects of unhappiness and stress on mortality that others have claimed,” Dr. Peto said. Unhappiness itself may not affect health directly, but it can do harm in other ways, by driving people to suicide, alcoholism or other dangerous behaviors, he warned. This type of study, which depends on participants’ self-assessments, is not considered as reliable as a rigorously designed experiment in which subjects are picked at random and assigned to a treatment or control group. But the huge number of people in this study gives it power. Still, some observers noted that measuring emotions is more nuanced and complex than simply declaring happiness or unhappiness. “I would have liked to see more discussion of how people translate these complicated feelings into a self-report of happiness,” said Baruch Fischhoff, a psychologist at Carnegie Mellon University who studies decision-making, who was not involved in the study. “Think about everything that’s going on in your life and tell me how happy you are. Happiness is a squishy measure.” The results of earlier studies have been mixed, with some finding that unhappiness causes illness and others showing no link, Dr. Fischhoff said. “It looks to me like people have collected a lot of data without finding a clear signal,” he said. “So if there is some correlation out there, it’s not very big.” An editorial accompanying the study in The Lancet noted that it had “the largest population so far in happiness studies,” and praised its statistical methods. But it also said more research was needed. Professor Peto said he doubted that the new study would change many minds because beliefs about the perils of unhappiness are so ingrained. “People are still going to believe that stress causes heart attacks,” he said. www.nytimes.com/2015/12/10/health/happiness-health-study.html?_r=0 |
|
|
|
Post by jeffolie on Dec 10, 2015 6:30:23 GMT -6
Middle class Americans now comprise less than half, or 49.9%, of the nation's population, down from 61% in 1971, according to a new Pew Research Center report. Pew defined middle class as households earning between two-thirds and twice the overall median income, after adjusting for household size. A family of three, for example, would be considered middle income if its total annual income ranged from about $42K-$126K. seekingalpha.com/news/2975646-americas-middle-class-no-longer-the-majority?ifp=0 |
|
|
|
Post by jeffolie on Dec 4, 2015 17:04:57 GMT -6
December 04, 2015 Spending by Generation, 2014 In an experimental research effort, the Bureau of Labor Statistics has examined household spending by generation based on data from the 2014 Consumer Expenditure Survey (birth years based on Pew Research Center definitions)... Average household spending in 2014 Millennials (1981 and later): $43,942 Generation X (1965 to 1980): $63,137 Baby Boomers (1946 to 1964): $58,202 Silent Generation (1929 to 1945): $40,923 WWII Generation (1928 and earlier): $32,610 Gen Xers spend much more on mortgage interest than any other generation. Many bought homes when housing prices were peaking. Millennials, Gen Xers, and Boomers spend more on cell service than landline service. Eighty percent of Millennial households own a car. Ownership peaks at 91 percent among Boomers and falls with age to 66 percent in the WWII generation (aged 86 or older). Gen Xers spend the most on men's clothes. Boomers spend the most on women's clothes. Average household spending on entertainment is highest among Gen Xers. Millennials spend relatively little on entertainment, surpassing only the WWII generation. Even the Silent generation spends more on entertainment than Millennials. Source: Bureau of Labor Statistics, CE Experimental Research Tables demomemo.blogspot.com/ |
|
|
|
Post by jeffolie on Nov 27, 2015 15:40:41 GMT -6
November 27, 2015 Empty Piggy Banks How much money could the typical household access within 30 days to cover the cost of a financial shock? According to the Survey of American Family Finances, the median household could get its hands on just $3,000 within 30 days. That's not much of a buffer, and it includes credit cards and help from friends and family. In the second of three reports on the finances of American households, Pew Charitable Trusts examines the financial assets available to families when they experience a financial shock. That's when, not if. Financial shocks are the norm. Fully 60 percent of households experienced a financial shock in the past year, according to the findings of Pew's first report, available here. One of the most important resources for weathering a financial shock is liquid savings, which Pew defines as money in a checking or savings account, cash saved at home, and the value of unused prepaid cards. The typical household has only $3,800 in liquid savings, and a substantial one in four has less than $400. Source: The Pew Charitable Trusts, What Resources Do Families Have for Financial Emergencies? demomemo.blogspot.com/ |
|
|
|
Post by jeffolie on Nov 26, 2015 17:18:07 GMT -6
November 25, 2015 Median Age at First Marriage: 2015 Women: The median age of women marrying for the first time inched up to 27.1 in 2015, a bit higher than the 27.0 of 2014 and a full seven years above the all-time low of 20.1 in 1956. Men: The median age of men marrying for the first time fell slightly to 29.2 in 2015, a bit lower than the 29.3 of 2014 and nearly seven years greater than the 22.5 low of 1956. Source: Census Bureau, Families and Living Arrangements, Historical Time Series demomemo.blogspot.com/ |
|
|
|
Post by jeffolie on Nov 21, 2015 9:26:50 GMT -6
San Francisco real estate looking like it did before dot-com crash in 2000 By Daniel Goldstein Published: Nov 21, 2015 Surging rents, skyrocketing real-estate prices and booming tech companies. Sounds like San Francisco in 2015, right? It also describes the city just before the tech bust of 2000, according to a recent report. John Burns Real Estate Consulting of Irvine, Calif., and Pacific Union, a San Francisco real-estate brokerage, say that based on the appreciation (and apparent correlation) of venture capital deals and rent prices, the rise in the Bay Area’s rapid real estate and rent price appreciation today is looking more like a repeat of the dot-com bust of 2000. “The San Francisco Bay Area is on our watch list for a correction,” said John Burns, his company’s chief executive, in an interview. He said that while San Francisco has become a permanently more expensive place to live and should be one of the most expensive places to live in the world because of its status as the center of the high-tech and Internet economy, the recent increases in home prices and rents have been fueled mainly by speculation. “Affluent older buyers, often for investment reasons, have identified San Francisco as a place they want to own or live and have driven up prices dramatically,” he said. About a third of all-cash buyers in the Bay Area are purchasing property only as an investment, he said. In the City of San Francisco, the median value of homes has skyrocketed, from $670,000 in the beginning of 2012 to $1.1 million this month, a gain of more than 67%, and a gain of 15% in the past year alone, according to Zillow.com. But to gauge when such a correction might occur, you need to look to venture capital deals — and rent prices, he said. Burns and Pacific Union noted that the size of the average venture capital (VC) deal rose from $4.9 million in 1997 to $17 million in 2000, a 243% increase. At the same time, apartment rents in San Francisco and San Jose increased by 52% and 60%, respectively. Burns also noted that in the three years that followed — as VC funding collapsed during the 2001 recession and the turmoil that followed the September 11 attacks — rents fell in with the decline in VC funding, which plunged from an average of $16 million per VC deal in 2001 to just over $7 million by 2004, a decline of over 50%. During the same time frame, average rents in San Francisco plunged from about $2,300 a month in mid-2001 to about $1,600 by 2004, a decline of about 30%, according to data compiled by Burns’ group from PricewaterhouseCoopers, Axiometrics Inc. and Thomson/Reuters. Rents in San Jose fell even further, from a similar average of $2,300 a month to $1,400 a month, or a decline of about 39%, Burns’ research showed. The current tech sector upswing in the Bay Area is presenting a similar relationship between VC funding and apartment rents, said Burns. In 2010, the average VC deal in the Bay Area was $6.9 million, but had risen to $23.5 million in 2015, a 240% increase, Burns says. At the same time, just like in the 1997 to 2000 period, average monthly rent for apartments in San Francisco and San Jose have shot up. In San Francisco, average rents have soared from about $1,900 a month back in 2010 to more than $3,200 today, a gain of 68%. In San Jose, the average rent in 2010 was about $1,600 a month. Now it’s $2,800, a gain of 75%. “Rents in San Francisco and San Jose have respectively eclipsed prior dot-com bubble peaks,” Burns said. “We think another decline this time around is inevitable.” www.marketwatch.com/story/san-francisco-real-estate-looking-like-it-did-before-dotcom-crash-in-2000-2015-11-20 |
|
|
|
Post by jeffolie on Nov 18, 2015 15:55:35 GMT -6
Six Kinds of Debt Fully 89 percent of Americans with credit records fall into one of six debt types, according to an Urban Institute analysis of millions of credit records over a five-year period of time... •29% have no debt •22% have only credit card debt •13% have only mortgage debt •12% have only vehicle debt •9% have vehicle and mortgage debt •4% have only student loan debt These "debt styles" depend on lifestage, of course. Mortgage debt, for example, peaks at 41 percent among consumers aged 48 to 52. Student loans peak at 23 percent among those aged 23 to 27. The Urban Institute report examines debt during the 2010-to-2014 time period by age of consumer, including loan balances and credit scores. Source: Urban Institute, Americans' Debt Styles by Age and Over Time demomemo.blogspot.com/ |
|