|
Post by jeffolie on Nov 9, 2013 16:20:04 GMT -6
'Weird' OBJECT, MOVING by its OWN JETS, seen beyond Mars orbit by Hubble Hubble snaps 'freakish' astro-thing 8th November 2013 
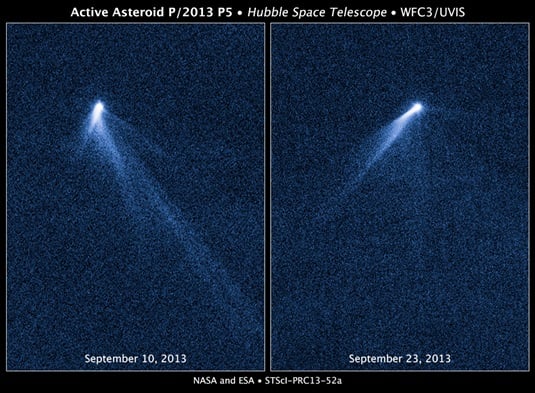
Pic A bizarre spinning object, described by NASA as "weird and freakish" and shooting jets of matter that cause it to move, has been spotted in our Solar System. The mysterious rock, located in the asteroid belt between Mars and Jupiter, was seen spewing matter from its surface by the Hubble space telescope on September 10. Then in a second image taken on September 23 the asteroid, dubbed P/2013 P5, appeared to have swung around significantly. Professor David Jewitt – of the Department of Earth and Space Sciences at the University of California, Los Angeles – told The Register that the appearance of the asteroid is unique, and the team has some ideas of how it came to exhibit such unusual characteristics. "One idea was that we were seeing ice on the asteroid outgassing, but the object is too hot, around 170 Kelvin, for ice," he explained. "An impact with the asteroid was discussed but that would leave one large plume, not six." The current idea is that the asteroid is being spun around so quickly that it is breaking apart under the strain of its own rotation. The spin is probably the result of hundreds of thousands of years of slight pressure from solar emissions. Stars like our Sun emit protons and radiation that can push against objects in its heliosphere, and for asteroids of a certain shape these emissions cause rotation. Since the pressure from the Sun is constant, and space is virtually frictionless, then asteroids can spin faster and faster until they disintegrate. This YORP effect (named after the four scientists who contributed to the theory: Yarkovsky, O'Keefe, Radzievskii, and Paddack) has been suggested as a reason for the relative paucity of small, asymmetrical objects within our Solar System in comparison to rounder rocks, and the search is now on for more observations of the theory in action. "In astronomy, where you find one, you eventually find a whole bunch more," said Prof Jewitt, whose study of the rock [PDF] was published in the Astrophysical Journal of Letters. "This is an amazing object and almost certainly the first of many more to come." www.theregister.co.uk/2013/11/08/hubble_spots_lawnsprinkler_asteroid_that_has_boffins_baffled/
|
|
|
Post by jeffolie on Nov 9, 2013 16:07:01 GMT -6
Machine Makers, toolists are in high demand ... they reprogram the specifications used by machines that create parts. In my sphere of acquaintances, one works as a Machine Maker, toolist. He creates specific parts needed in the oil industry which are not readily available elsewhere at market prices. He speaks and is required to speak Vietnamese.
Computer assisted machines, assisted by humans now are in big demand with some experience.
|
|
|
Post by jeffolie on Nov 9, 2013 16:01:07 GMT -6
November 7, 2013 Are Computers Making Society More Unequal? Posted by Joshua Rothman Ever since inequality began rising in the U.S., in the nineteen-seventies, people have debated its causes. Some argue that rising inequality is mainly the result of specific policy choices—cuts to education, say, or tax breaks for the wealthy; others argue that it’s an expression of larger, structural forces. For the last few years, Tyler Cowen, an economist at George Mason University and a widely read blogger, has been one of the most important voices on the latter side. In 2011, in an influential book called “The Great Stagnation,” Cowen argued that the American economy had exhausted the “low-hanging fruit”—cheap land, new technology, and high marginal returns on education—that had powered its earlier growth; the real story wasn’t inequality per se, but rather a general and inevitable economic slowdown from which only a few sectors of the economy were exempt. It was not a comforting story. “Average Is Over,” Cowen’s new book, is a sequel to, and elaboration upon, “The Great Stagnation.” In many ways, it’s even less comforting. It’s not just, Cowen writes, that the old economy, built on factory work and mid-level office jobs, has stagnated. It’s that the nature of work itself is changing, largely because of the increasing power of intelligent machines. Smart software, Cowen argues, is transforming almost everything about work, and ushering in an era of “hyper-meritocracy.” It makes workers redundant, by doing their work for them. It makes work more unforgiving, by tracking our mistakes. And it creates an entirely new class of workers: people who know how to manage and interpret computer systems, and whose work, instead of competing with the software, augments and extends it. Over the next several decades, Cowen predicts, wages for that new class of workers will grow rapidly, while the rest will be left behind. Inequality will be here to stay, and that will affect not only how we work, but where and how we live. If we want a preview of work in the twenty-twenties and twenty-thirties, Cowen writes, we should look to the areas where computer intelligence is already making a big difference: areas like dating, medicine, and even chess. This interview with Cowen has been edited and condensed from two conversations. In “Average Is Over,” you argue that inequality will grow in the U.S. for the next several decades. Why? There are three main reasons inequality is here to stay, and will likely grow. The first is just measurement of worker value. We’re doing a lot to measure what workers are contributing to businesses, and, when you do that, very often you end up paying some people less and other people more. The second is automation—especially in terms of smart software. Today’s workplaces are often more complicated than, say, a factory for General Motors was in 1962. They require higher skills. People who have those skills are very often doing extremely well, but a lot of people don’t have them, and that increases inequality. And the third point is globalization. There’s a lot more unskilled labor in the world, and that creates downward pressure on unskilled labor in the United States. On the global level, inequality is down dramatically—we shouldn’t forget that. But within each country, or almost every country, inequality is up. You think that intelligent software, especially, will make the labor market more unequal. Why is that the case? Because of the cognitive requirements of working with smart software. And it’s also about training. There’s a big digital divide in this country. One of the most interesting sections of the book is about “freestyle” chess competitions, in which humans and computers play on teams together—often the computers make the moves, but sometimes the humans intervene. How has chess software changed the “labor market” in chess players? When humans team up with computers to play chess, the humans who do best are not necessarily the strongest players. They’re the ones who are modest, and who know when to listen to the computer. Often, what the human adds is knowledge of when the computer needs to look more deeply. If you’re a really good freestyle player, you consult a bunch of different programs, which have different properties, and you analyze the game position on all of them. You try to spot, very quickly, where the programs disagree, and you tell them to look more deeply there. They may disagree along a number of lines, and then you have to make some judgments. That’s hard—but the good humans do that better than computers do. Even very strong computers don’t have that meta-rational sense of when things are ambiguous. Today, the human-plus-machine teams are better than machines by themselves. It shows how there may always be room for a human element. You believe that, in the future, the most well-compensated workers will be something like freestyle chess players. Think in terms of this future middle-class job: You read medical scans, and you work alongside a computer. The computer does most of the judging, but there are some special or unusual scans where you say, “Hmm, that’s not quite right—I need a doctor to look at this again and study it more carefully.” You’ll need to know something about medicine, but it won’t be the same as being a doctor. You’ll need to know something about how these programs work, but it won’t be the same as being a programmer. You’ll need to be really good at judging, and being dispassionate, and you’ll have to have a sense of what computers can and cannot do. It’s about working with the machine: knowing when to hold back, when to intervene. Or take business negotiations. In the early stages of negotiation software, on your smartphone, there may be programs that listen to the pitch of a voice, or that test for stress. You’ll just ask the program, “Was he lying? Was he eager to do business with me?” Maybe the computer will be right sixty per cent of the time. That’s useful information, but it’s still going to be wrong a lot. And in a given negotiation, you’ll be reading off many programs, and you’ll have to decide which of those programs is more relevant. How do you learn to be fluent with these sorts of smart, digital tools? How do people learn to become freestyle chess players, for example? People have learned from computers. Computers are the best teachers in the world. You can download programs for free, or for forty bucks. They don’t just play against you; they can teach you. That touches on another software revolution: online education. Many people think that, because online education will be cheap and widely available, it will be a democratizing force. But you argue that there’s another possibility—that it will only deepen inequality. Why? Because of the premium it places on conscientiousness. There’s so much free material on the Internet you can learn from, and some people are pure self-starters: they pick up computers and teach themselves everything. Certainly there are millions of people like that. But at the same time, I think it’s a pretty small percentage of the population. Most of us are not pure self-starters; most people need role models, they need coaches, they need exemplars, they maybe need some discipline or some rewards. We need to be motivated. [Motivation] will be a big growth sector. One of the ironies you write about in “Average Is Over” is that, while the smart-software world will reward the most conscientious and self-motivated people, it will also feel increasingly zany. Our computers will tell us to do things that feel counterintuitive or seem risky. Behavior might become less “average.” This new world will look strange to us. Take online dating. One could imagine that future [dating algorithms] will, for example, just maximize our chances of a good marriage. So we might, in some cases, be quite forward with people, more than we would naturally feel is appropriate. In the book, you write that algorithms might urge us to go out with apparently unlikely partners—they might even guide us during our dates, monitoring our heart rates and sending us text messages like “Kiss her now!” Maybe most of the time it won’t go very well—you’ll get rejected quickly or you’ll look like a fool—and it’ll feel wrong to us. But if that risky behavior increases your chances of connecting with the right person quickly enough, before they end up meeting someone else, it might nonetheless be good. And there will be Luddites of a sort. “Here are all these new devices telling me what to do—but screw them; I’m a human being! I’m still going to buy bread every week and throw two-thirds of it out all the time.” It will be alienating in some ways. We won’t feel that comfortable with it. We’ll get a lot of better results, but it won’t feel like utopia. Let’s say you’re right. Only some people—you’ve proposed fifteen per cent of the population—find it easy to work with intelligent machines, and want to live what you call, in the book, a “hyper-meritocratic” lifestyle. They’re very well paid, and they pull away from the rest of the country. Inequality grows. How do you see that playing out over the long term? Well, there’s a lot of evidence that fewer people are living in old-style, middle-class neighborhoods. You see this in American cities. Manhattan is far wealthier than before; Washington, D.C., is rapidly gentrifying. Meanwhile, places like Texas are absorbing more poor people, who are leaving places like California or New York. So I think we’re seeing much more geographic segregation by income class. I think there will be much larger numbers of people who live somewhat bohemian, [freelance] lifestyles, who culturally feel very upper-middle-class or even upper-class, but who don’t have that much money. (Think of many parts of Brooklyn.) Those individuals will be financially precarious, but live happy, productive lives. How we evaluate that ethically is very tricky. Still, I think that’s what we’re going to see. Most people who write about inequality write in a tone of moral outrage, and make suggestions about how we might reverse its growth. You seem to have deliberately avoided that; you’ve written about it in purely predictive terms. I do, in numerous places, point out things we might do to make inequality problems less severe. (Mostly we’re not doing them.) But I think that to dispassionately lay out the facts is often the best first thing to do, to open up that dialogue—to step back first, and view things more analytically, and then to apply our judgments. Do you think that you are less alarmed about inequality than other writers on the subject? Why might that be? I’ve spent a lot of time working with very poor people in rural Mexican villages. There, a family of seven might have an income of one thousand or two thousand dollars a year. And I see how they live. I understand really pretty clearly the very serious problems they face. But I also see very clearly the value in their lives. Or, let me put in another way. In the U.S., New York City is probably the most unequal place we’ve got. And I find it striking how many people believe, first, that inequality is terrible, and that this vision for the future is horrible, and, at the same time, think, “Oh, I love New York City!” We already have places with extreme inequality, but life there goes on, and we don’t recoil in horror. The non-wealthy parts of New York are very vital, and have the best of humanity in them. We have intuitions [about equality and inequality] that are derived from American post-war history. I don’t want to dismiss those intuitions altogether, but I think we need to be more skeptical of them. The whole narrative you unfold—intelligent software, human-computer cooperation, deferring to our smartphones—sounds very futuristic. Do you think we’re living through a historically unprecedented period? I don’t accept the view that this new era is so different from every time in the past. Consider the industrial revolution, which starts in Great Britain in the seventeen-seventies or seventeen-eighties. For a long time, you had rising inequality, fairly stagnant living standards, a lot of problems adjusting. Of course, we did eventually get over it in the longer run, and it was much better for everyone. But it took, arguably, fifty or sixty years for us to make that transition. I think this future wave of inequality, which is already underway, will be a lot like that. It will take us decades to make the transition. Those decades will bring a lot of problems. But I think that in the much longer run—which is not what the book is about—it will be much more positive than it will seem during the transition era. I think this period fits quite nicely with historical precedent. www.newyorker.com/online/blogs/currency/2013/11/when-machines-replace-humans-at-work.html?mbid=gnep&google_editors_picks=true
|
|
|
Post by jeffolie on Nov 9, 2013 14:38:56 GMT -6
In my sphere of acquaintances, one man works the robo calls for collections on subprime auto loans as an IT job. The borrowers sign away their rights to put these specific robo calls onto the federal Do Not Call register. But for these very likely to fail loans many would be unable to drive to work in the Greater Los Angeles job market where bus transportation is sketchy, overcrowded, slow and often just non existent to reach the workplaces.
|
|
|
Post by jeffolie on Nov 9, 2013 14:25:43 GMT -6
No Car, No FICO Score, No Problem: The NINJAs Have Taken Over The Subprime Lunatic Asylum 11/08/2013 One of the most trumpeted stories justifying the US economic "recovery" is the resurgence in car sales, which have now returned to an annual sales clip almost on par with that from before the great depression. What is conveniently left out of all such stories is what is the funding for these purchases (funnelling through to the top and bottom line of such administration darling companies as GM) comes from. The answer: the same NINJA loans, with non-existent zero credit rating requirements that allowed anything with a pulse to buy a McMansion during the peak day of the last credit bubble. Bloomberg reports on an issue we have been reporting for over a year, namely the 'stringent' credit-check requirements for new car purchasers by recounting the story of Alan Helfman, a car dealer in Houston, who served a woman in his showroom last month with a credit score lower than 500 and a desire for a new Dodge Dart for her daily commute. She drove away with a new car. So there you have it: No Car, no FICO score, no problem. The NINJAs have once again taken over the subprime asylum. This time, it seems, is different: because anyone can get a loan. A year ago, with a credit ranking in the bottom eighth percentile, “I would’ve told her don’t even bother coming in,” said Helfman, who owns River Oaks Chrysler Dodge Jeep Ram, where sales rose about 20 percent this year. “But she had a good job, so I told her to bring a phone bill, a light bill, your last couple of paycheck stubs and bring me some down payment.” Nevermind that a FICO < 500 means that not only will her job be gone in a few weeks, and that she will likely repay a single-digit percentage fraction of the total loan. What matters is she showed, well, signs of life - which makes her immediately eligible for all the loans that the government is fit to hand out. And frankly why not: with the US essentially insolvent, and now holding on to every day that the USD is still a reserve currency like dear life, who can blame her or the countless others like her, who have given the impression the economy is recovering when it is merely going through all the final strokes before it all, once again, comes crashing down? Is it possible that barely five years later, everyone has forgotten what happened the last time anyone who wanted credit got it? And what will happen when those who don't even have a phone bill or a light bill, nevermind a job, come asking for a Dodge Dart? Why yes: the Pied Piper of Marriner Eccles is playing the music ever louder, and so all must dance. Luckily, even the mainstream media is finally catching on to the fact that all the "gains" in the best economic sector have been on the back of subprime. While surging light-vehicle sales have been one of the bright spots in the U.S. economy, it’s increasingly being fueled by borrowers with imperfect credit. Such car buyers account for more than 27 percent of loans for new vehicles, the highest proportion since Experian Automotive started tracking the data in 2007. That compares with 25 percent last year and 18 percent in 2009, as lenders pulled back during the recession.
Issuance of bonds linked to subprime auto loans soared to $17.2 billion this year, more than double the amount sold during the same period in 2010, according to Harris Trifon, a debt analyst at Deutsche Bank AG. The market for such debt, which peaked at about $20 billion in 2005, was dwarfed by the record $1.2 trillion in mortgage bonds sold that year. Of course, the enablers of this destructive behavior see nothing wrong, and live under the delusion that sub-500 FICO borrowers will actually pay them back. “It’s a good investment” for lenders, Helfman said. “A person that has to get from point A to point B, they’re not going to jeopardize their job. They have to pay the car payment before they pay anything else.”
His Dodge Dart customer with the bad credit had to pay a higher than average interest rate.
“It wasn’t pretty, but it wasn’t crazy,” he said. She was “so happy she couldn’t see straight.” Of course she did: Greece too was happy when it found Germany - an idiot lender who fund the Greek drunken spending for a decade (mostly on made in Germany military equipment). And like the lender, Germany too was happy: it found a willing idiot to buy everything it had to sell funded by "vendor financing." Well all know how that relationship ended. And end again it will, because subprime borrowers are the ones who can least afford the highest interest rates, which by definition flow through to the riskiest borrowers. Fifty-eight percent of loans taken out to purchase Chrysler Group LLC’s Dodge brand vehicles in October were with loans above the industry average of 4.2 percent annual percentage rate, according to Edmunds, a researcher that tracks vehicle sales.
The average loan for a Dodge charged an APR of 7.4 percent, and 23 percent of the loans had APRs of more than 10 percent, making it the brand with the highest percentage of loans for more than 10 percent, followed closely by Chrysler and Mitsubishi. Rates on subprime auto loans can climb to 19 percent, according to S&P.
Dodge U.S. sales rose 17 percent this year through October compared with a year earlier, propelling Chrysler Group to 43 straight months of rising sales.
“Right now, you have to have fairly bad credit to be paying above 3 percent,” Jessica Caldwell, an analyst with Edmunds, said in a telephone interview.
But since nobody has blown up to date as a result of this latest micro credit bubble, it must mean everyone is welcome to dance. Sure enough: An influx of new competitors into subprime auto-lending since 2010 is sparking concern of eroding underwriting standards, according to S&P. About 13 issuers have accessed the asset-backed market to fund subprime auto loan originations this year, according to Citigroup Inc.
Among the issuers accessing the asset-backed market this year are GM Financial, the lender founded in 1992 and known as AmeriCredit before it was acquired by General Motors Co. in 2010, and new entrants such as Blackstone Group LP’s Exeter Financial Corp.
“We are still skeptical that all of today’s subprime auto players will thrive,” Citigroup analysts led by Mary Kane said in an Oct. 10 report. The successful companies will be those that can underwrite and collect on loans while holding costs and defaults to a minimum, the Citigroup report said. We are skeptical that Citi will thrive when the bubble pops, but that's irrelevant. For now, let the good LTV times roll. LTVs of a whopping 114.5%. Consider Exeter Finance Corp., which was acquired by Blackstone Group LP in 2011. Moody’s Investors Service won’t grant high-investment-grade rankings to asset-backed deals sold by the Irving, Texas-based company, citing its limited experience and performance history.
It has had higher loss rates compared with other lenders, S&P said in a Sept. 17 report. Julie Weems, a spokeswoman for Exeter, declined to comment on the company’s losses.
Exeter has issued $900 million of the bonds this year, including $589 million of securities rated AAA by Toronto-based DBRS LTD and AA by S&P, data compiled by Bloomberg show.
In Exeter’s most recent deal in September, a $500 million issue backed by 26,591 loans, the average loan was 112.4 percent of the value of the car, up from 111.9 percent in a previous offering sold in May, according to a presale report from S&P. The average loan-to-value ratio, or LTV, on vehicle sales to consumers with spotty credit is 114.5 percent this year, compared with a peak of 121 percent in 2008. It is so bad that even Morgan Stanley now gets it: “Perhaps more than any other factor, easing credit has been the key to the U.S. auto recovery,” Adam Jonas, a New York-based analyst with Morgan Stanley, wrote in a note to investors last month. The rise of subprime lending back to record levels, the lengthening of loan terms and increasing credit losses are some of factors that lead Jonas to say there are “serious warning signs” for automaker’s ability to maintain pricing discipline. And who gets to eat the losses? Well, as we showed yesterday, the bulk of consumer credit issuance in the past year, a massive 99%, has been sourced by the government to go straight into auto and student loans. Which means you, dear US taxpayer, will once again be on the hook when the music ends. www.zerohedge.com/news/2013-11-08/no-car-no-fico-score-no-problem-ninjas-have-taken-over-subprime-lunatic-asylum
|
|
|
Post by jeffolie on Nov 9, 2013 12:19:54 GMT -6
|
|
|
Post by jeffolie on Nov 9, 2013 11:47:43 GMT -6
|
|
|
Post by jeffolie on Nov 9, 2013 11:02:51 GMT -6
Right Wing’s Surge in Europe Has the Establishment Rattled November 8, 2013 HVIDOVRE, Denmark — As right-wing populists surge across Europe, rattling established political parties with their hostility toward immigration, austerity and the European Union, Mikkel Dencker of the Danish People’s Party has found yet another cause to stir public anger: pork meatballs missing from kindergartens. A member of Denmark’s Parliament and, he hopes, mayor of this commuter-belt town west of Copenhagen, Mr. Dencker is furious that some day care centers have removed meatballs, a staple of traditional Danish cuisine, from their cafeterias in deference to Islamic dietary rules. No matter that only a handful of kindergartens have actually done so. The missing meatballs, he said, are an example of how “Denmark is losing its identity” under pressure from outsiders. The issue has become a headache for Mayor Helle Adelborg, whose center-left Social Democratic Party has controlled the town council since the 1920s but now faces an uphill struggle before municipal elections on Nov. 19. “It is very easy to exploit such themes to get votes,” she said. “They take a lot of votes from my party. It is unfair.” It is also Europe’s new reality. All over, established political forces are losing ground to politicians whom they scorn as fear-mongering populists. In France, according to a recent opinion poll, the far-right National Front has become the country’s most popular party. In other countries — Austria, Britain, Bulgaria, the Czech Republic, Finland and the Netherlands — disruptive upstart groups are on a roll. This phenomenon alarms not just national leaders but also officials in Brussels who fear that European Parliament elections next May could substantially tip the balance of power toward nationalists and forces intent on halting or reversing integration within the European Union. “History reminds us that high unemployment and wrong policies like austerity are an extremely poisonous cocktail,” said Poul Nyrup Rasmussen, a former Danish prime minister and a Social Democrat. “Populists are always there. In good times it is not easy for them to get votes, but in these bad times all their arguments, the easy solutions of populism and nationalism, are getting new ears and votes.” In some ways, this is Europe’s Tea Party moment — a grass-roots insurgency fired by resentment against a political class that many Europeans see as out of touch. The main difference, however, is that Europe’s populists want to strengthen, not shrink, government and see the welfare state as an integral part of their national identities. The trend in Europe does not signal the return of fascist demons from the 1930s, except in Greece, where the neo-Nazi party Golden Dawn has promoted openly racist beliefs, and perhaps in Hungary, where the far-right Jobbik party backs a brand of ethnic nationalism suffused with anti-Semitism. But the soaring fortunes of groups like the Danish People’s Party, which some popularity polls now rank ahead of the Social Democrats, point to a fundamental political shift toward nativist forces fed by a curious mix of right-wing identity politics and left-wing anxieties about the future of the welfare state. “This is the new normal,” said Flemming Rose, the foreign editor at the Danish newspaper Jyllands-Posten. “It is a nightmare for traditional political elites and also for Brussels.” The platform of France’s National Front promotes traditional right-wing causes like law and order and tight controls on immigration but reads in parts like a leftist manifesto. It accuses “big bosses” of promoting open borders so they can import cheap labor to drive down wages. It rails against globalization as a threat to French language and culture, and it opposes any rise in the retirement age or cuts in pensions. Similarly, in the Netherlands, Geert Wilders, the anti-Islam leader of the Party for Freedom, has mixed attacks on immigration with promises to defend welfare entitlements. “He is the only one who says we don’t have to cut anything,” said Chris Aalberts, a scholar at Erasmus University in Rotterdam and author of a book based on interviews with Mr. Wilders’s supporters. “This is a popular message.” Mr. Wilders, who has police protection because of death threats from Muslim extremists, is best known for his attacks on Islam and demands that the Quran be banned. These issues, Mr. Aalberts said, “are not a big vote winner,” but they help set him apart from deeply unpopular centrist politicians who talk mainly about budget cuts. The success of populist parties, Mr. Aalberts added, “is more about the collapse of the center than the attractiveness of the alternatives.” Pia Kjaersgaard, the pioneer of a trend now being felt across Europe, set up the Danish People’s Party in 1995 and began shaping what critics dismissed as a rabble of misfits and racists into a highly disciplined, effective and even mainstream political force. Ms. Kjaersgaard, a former social worker who led the party until last year, said she rigorously screened membership lists, weeding out anyone with views that might comfort critics who see her party as extremist. She said she had urged a similar cleansing of the ranks in Sweden’s anti-immigration and anti-Brussels movement, the Swedish Democrats, whose early leaders included a former activist in the Nordic Reich Party. Marine Le Pen, the leader of France’s National Front, has embarked on a similar makeover, rebranding her party as a responsible force untainted by the anti-Semitism and homophobia of its previous leader, her father, Jean-Marie Le Pen, who once described Nazi gas chambers as a “detail of history.” Ms. Le Pen has endorsed several gay activists as candidates for French municipal elections next March. But a whiff of extremism still lingers, and the Danish People’s Party wants nothing to do with Ms. Le Pen and her followers. Built on the ruins of a chaotic antitax movement, the Danish People’s Party has evolved into a defender of the welfare state, at least for native Danes. It pioneered “welfare chauvinism,” a cause now embraced by many of Europe’s surging populists, who play on fears that freeloading foreigners are draining pensions and other benefits. “We always thought the People’s Party was a temporary phenomenon, that they would have their time and then go away,” said Jens Jonatan Steen, a researcher at Cevea, a policy research group affiliated with the Social Democrats. “But they have come to stay.” “They are politically incorrect and are not accepted by many as part of the mainstream,” he added. “But if you have support from 20 percent of the public, you are mainstream.” In a recent meeting in the northern Danish town of Skorping, the new leader of the Danish People’s Party, Kristian Thulesen Dahl, criticized Prime Minister Helle Thorning-Schmidt, of the Social Democrats, whose government is trying to trim the welfare system, and spoke about the need to protect the elderly. The Danish People’s Party and similar political groups, according to Mr. Rasmussen, the former prime minister, benefit from making promises that they do not have to worry about paying for, allowing them to steal welfare policies previously promoted by the left. “This is a new populism that takes on the coat of Social Democratic policies,” he said. In Hvidovre, Mr. Dencker, the Danish People’s Party mayoral candidate, wants the government in, not out of, people’s lives. Beyond pushing authorities to make meatballs mandatory in public institutions, he has attacked proposals to cut housekeeping services for the elderly and criticized the mayor for canceling one of the two Christmas trees the city usually puts up each December. Instead, he says, it should put up five Christmas trees. www.nytimes.com/2013/11/09/world/europe/right-wings-surge-in-europe-has-the-establishment-rattled.html?hp&_r=0
|
|
|
Post by jeffolie on Nov 9, 2013 10:51:11 GMT -6
BOULDER, Colo., Nov. 8 (UPI) -- Wind turbines killed at least 600,000 -- and possibly as many as 900,000 -- bats in the United States in 2012, researchers say. Writing in the journal BioScience, the researchers said they used sophisticated statistical techniques to infer the probable number of bat deaths at wind energy facilities from the number of dead bats found at 21 locations. Bats, which play an important role in the ecosystem as insect-eaters, are killed at wind turbines not only by collisions with moving turbine blades but also by the trauma resulting from sudden changes in air pressure that occur near a fast-moving blade, the study said. Study author Mark Hayes of the University of Colorado notes that 600,000 is a conservative estimate -- the true number could be 50 percent higher than that -- and some areas of the country might experience much higher bat fatality rates at wind energy facilities than others. Hayes said the Appalachian Mountains have the highest estimated fatality rates in his analysis. With bats already under stress because of climate change and disease, in particular white-nose syndrome, the estimate of wind turbine deaths is worrisome, he said -- especially as bat populations grow only very slowly, with most species producing only one young per year. www.breitbart.com/Big-Government/2013/11/09/Wind-turbines-blamed-in-death-of-estimated-600-000-bats-in-2012
|
|
|
Post by jeffolie on Nov 9, 2013 9:02:33 GMT -6
While urban legend retains the meme that the Middle Class has mostly recovered because of the rise in house prices ... this well done St. Louis Fed piece points clearly to the Middle Class as not sharing very much in the increased wealth thus repeating that the Type 1 rich consumer gained most of the wealth increase ... many former middle class lost their houses and now rent as newly divorced ... the rich get richer holds true for the mini housing price bubble now topping.
my jeffolie view: the most common American suffers a regular depression while the Type 1 rich consumer thrives on both record high stock prices and the mini housing bubble.
|
|
|
Post by jeffolie on Nov 9, 2013 8:46:03 GMT -6
Housing Rebound Broadens the Wealth Recovery But Much More is Needed William R. Emmons and Bryan J. Noeth St. Louis Fed, November 2013 When adjusted for inflation and growth in the number of households, however, average real net worth has recovered only 76 percent of the loss incurred between 2007 and 2009. The slow recovery of wealth is due primarily to housing, which only began to rise in value at the beginning of 2012. The faster recovery of financial assets mainly has benefited wealthier families, who own most of the economy’s stocks and other financial assets. In this article, we show that the nascent housing recovery appears to reflect rising prices of relatively more expensive houses. This also likely benefits wealthy families more than those who own lower-value houses or are renters.
Housing Recovery Underway For the sixth consecutive quarter, rising house prices contributed strongly to overall household wealth recovery. The total value of owners’ equity in household real estate (henceforth, homeowners’ equity) reached $9.3 trillion at the end of the second quarter of 2013, up 50.1 percent since the fourth quarter of 2011 and the highest level in more than five years.1 In dollar terms, the $3.1 trillion increase in homeowners’ equity since the end of 2011 nearly matches the $4.1 trillion increase in households’ stock-market equity shares during the same time period. Despite the strong recovery to date, housing values and homeowners’ equity remain far below peak levels. After adjusting for inflation and growth in the number of homeowners, average homeowners’ equity at the end of the second quarter of 2013 (about $125,000) was slightly less than the value achieved in the second quarter of 2000, some 13 years ago (Figure 2). Inflation-adjusted per-capita disposable personal income, by way of comparison, increased 16.7 percent during that time. The current average inflation-adjusted value of homeowners’ equity remains 38.3 percent lower than its peak value in early 2006, although that is a significant improvement from the end of 2011, when the value was 58.6 percent lower than peak value. Uneven Distribution of Housing Wealth Gains Even more important than inflation and growth adjustments, the distribution of house-price gains—that is, which house prices are increasing faster and which slower—determines how broad the housing-driven wealth recovery will be. One way to gauge how widespread house-price increases have been is to compare two different kinds of house-price indexes: value weighted and equal weighted.2 Examples of the former are the CoreLogic Home Price Index and the S&P/Case-Shiller Home Price Index.3 Examples of the latter include a variety of indexes compiled by the Federal Housing Finance Agency (FHFA); we focus on the FHFA’s expanded data house-price index.4 All three provide very broad nationwide coverage and are comparable except for how they weight individual house prices. The value-weighted indexes assign relatively more weight to more expensive homes—that is, a home’s market value determines its contribution to the index—while the equal-weighted indexes treat all homes the same, regardless of how expensive they are. If the prices of all houses of all values are changing at the same rate, both types of index will yield the same result. On the other hand, if the prices of high-value houses are rising faster (or slower) than the prices of low-value houses, the value-weighted indexes will show faster (slower) rates of appreciation. For example, suppose there were only three houses in a market, valued originally at $100,000, $200,000 and $300,000. Assume that only the value of the $300,000 house changed, and it doubled in price. A value-weighted index would show a 50 percent increase in house prices ($600,000 in total housing value had increased to $900,000), while the equal-weighted index would show a 33 percent increase (calculated as the average of two zero percent gains and one 100 percent gain). Although only the value-weighted index captures the total wealth change in the market, the equal-weighted index is more representative in the sense that the two families with unchanged house prices find the 33 percent gain closer to their own experience than a 50 percent gain. Moreover, the median family (with a $200,000 house) also perceives the equal-weighted price gain as closer to its own experience. Figure 3 plots two inflation-adjusted value-weighted national home-price indexes (CoreLogic and Case-Shiller) against an inflation-adjusted equal-weighted national house-price index (FHFA expanded data), setting their respective values equal to 100 in the first quarter of 2000. The value-weighted indexes were more volatile over the period shown, rising roughly twice as high as the FHFA index by 2006, then falling much more in percentage terms through the end of 2011, when they all reached their low points. We therefore can infer that, on average, higher-priced houses rose and fell by greater percentages than lower-priced houses. For example, many high-value homes in California increased by large percentages before falling by large amounts, while many low-value homes in Midwest states like Missouri increased and decreased by smaller percentages. There are two relevant features of the chart for judging the distribution of gains in the nascent housing recovery to date. First, at the trough in late 2011, the equal-weighted FHFA index was noticeably lower than either of the value-weighted indexes, even though they all began at 100 in early 2000. We can infer that, on balance, the net percentage price change between 2000 and 2011 was greater for higher-value homes than for lower-value homes because value-weighted indexes represent higher-value homes’ price movements more closely. The second important fact is that the value-weighted indexes have increased more sharply since the 2011 trough than the equal-weighted index. In particular, the inflation-adjusted CoreLogic and Case-Shiller indexes have increased by 12.7 and 11.8 percent, respectively, since the end of 2011. During the same period, the inflation-adjusted FHFA index increased by just 8.3 percent. Thus, higher-value homes generally have appreciated faster than lower-value homes. Putting together these two facts, we conclude that lower-value homes—such as the $100,000 and $200,000 houses in our example—generally fell to a deeper trough in 2011 and subsequently have recovered more slowly than their higher-value counterparts. The equal-weighted FHFA index better represents the experience of the typical homeowner than do either of the value-weighted indexes or the Fed’s estimate of household real-estate values, which essentially is a value-weighted index. High-Price States vs. Low-Price States Figure 4 compares the typical house-price experience of a California homeowner to that of a Missouri homeowner. The median house value in California in 2000 was about $334,000, versus about $148,000 in Missouri (both expressed in terms of 2012 dollars), so the figure compares the typical experience in a relatively high-priced state to that in a relatively low-priced state.5 The figure sets both states’ 2000 values equal to an index value of 100 to illustrate cumulative percent changes after that date. The figure shows that California (higher-value) houses experienced more volatility, settled in 2011 at a slightly higher level and have increased in value more sharply than Missouri (lower-value) houses through mid-2013. Figure 5 compares two other states with relatively high and low house prices. The median house price in Massachusetts in 2000 was about $288,000, while the median house price in Mississippi was about $156,000, both expressed in terms of 2012 dollars. Figure 6 compares Washington, D.C. (with a median house price of $311,000 in 2000) to West Virginia (where the median house price was $128,000 in 2000), both expressed in terms of 2012 dollars. Many other such comparisons are possible. The common pattern in Figures 4, 5 and 6 is consistent with the conclusion we drew from Figure 3 that the house-price recovery since the end of 2011 has been stronger among higher-value houses, not just in California but throughout much of the nation. The same is also true within many local markets. The price recovery to date often has been stronger for higher-value houses. Wealth Recovery Uneven across American Families If families facing more difficulty rebuilding their wealth today are more likely to own lower-value houses or to be renters, Figures 3 through 6 together suggest that the value of their homes may have increased less than the (value-weighted) national average (or none at all, if they rent). Therefore, the housing recovery to date likely has been of limited benefit to them. Just as stock-market gains have largely accrued to wealthier families, a significant share of housing-wealth gains to date also likely have benefited owners of higher-value homes who are likely to have above-average wealth. A broad-based housing recovery will be necessary to restore the wealth lost by the typical home-owning family because homeownership, unlike stock-market investment, typically is a non-wealthy family’s largest investment. The recent recovery in house prices and homeowners’ equity therefore is good news, but much more will be needed for the typical homeowner to recover fully from the deep wealth losses experienced in recent years. Figure 1 Measures of Household Wealth Household Net Worth SOURCES: Federal Reserve Board, Bureau of Economic Analysis, Census Bureau. Figure 2 Average Inflation-Adjusted Homeowners’ Equity Household Net Worth SOURCES: Federal Reserve Board, Bureau of Economic Analysis, Census Bureau. Figure 3 Inflation-Adjusted National House-Price Indexes Household Net Worth SOURCES: CoreLogic, Standard & Poor’s, Federal Housing Finance Agency, Bureau of Economic Analysis. Figure 4 Inflation-Adjusted Equal-Weighted House-Price Indexes Household Net Worth SOURCES: Federal Housing Finance Agency, Bureau of Economic Analysis. Figure 5 Inflation-Adjusted Equal-Weighted House-Price Indexes Household Net Worth SOURCES: Federal Housing Finance Agency, Bureau of Economic Analysis. Figure 6 Inflation-Adjusted Equal-Weighted House-Price Indexes Household Net Worth SOURCES: Federal Housing Finance Agency, Bureau of Economic Analysis. Endnotes 1.Financial Accounts of the United States, www.federalreserve.gov/releases/z1/. These figures are not adjusted for inflation or population growth. Total homeowners’ equity is the total value of all U.S. household real estate minus all outstanding home-mortgage debt. It constituted 12.4 percent of total household net worth at the end of the second quarter of 2013.[back to text] 2.All of the house-price indexes discussed here are repeat-sales indexes, which are designed to control for quality differences among individual homes, including size, amenities and location.[back to text] 3.For details see www.corelogic.com/about-us/researchtrends/home-price-index-report.aspx and us.spindices.com/index-family/real-estate/sp-case-shiller. In between biennial benchmarkings to Census Bureau data, the Federal Reserve uses quarterly changes in the CoreLogic value-weighted index to estimate the total value of household real estate in its Financial Accounts. This is because the data reported in the Financial Accounts are conceptually similar to value-weighted indexes.[back to text] 4.See www.fhfa.gov/?Page=14.[back to text] 5.Federal Housing Finance Board.[back to text] www.ritholtz.com/blog/2013/11/housing-rebound-broadens-the-wealth-recovery-but-much-more-is-needed/
|
|
|
Post by jeffolie on Nov 9, 2013 8:38:43 GMT -6
Schedule for Week of November 10th by Bill McBride on 11/09/2013 The key reports this week are the October Industrial Production and Capacity Utilization report and the September Trade Balance report. On Thursday, there will be a confirmation hearing for Janet Yellen as the new Fed Chair. Yellen is qualified, has an excellent track record (she has been "hawkish" when appropriate, and "dovish" when appropriate), and I expect she will be confirmed by a large majority. ----- Monday, November 11th ----- Government offices, banks and the bond market will be closed in observance of the Veteran's Day holiday. Stock markets will be open. ----- Tuesday, November 12th----- 7:30 AM ET: NFIB Small Business Optimism Index for October. 8:30 AM ET: Chicago Fed National Activity Index for September. This is a composite index of other data. ----- Wednesday, November 13th ----- 7:00 AM: The Mortgage Bankers Association (MBA) will release the results for the mortgage purchase applications index. ----- Thursday, November 14th ----- 8:30 AM: The initial weekly unemployment claims report will be released. The consensus is for claims to decrease to 330 thousand from 336 thousand last week. U.S. Trade Exports Imports8:30 AM: Trade Balance report for September from the Census Bureau. Imports and export were mostly unchanged in August. The consensus is for the U.S. trade deficit to increase to $39.1 billion in September from $38.8 billion in August. 10:00 AM: Confirmation Hearing, Nominee for Fed Chair Janet Yellen 11:00 AM: The Q3 2013 Quarterly Report on Household Debt and Credit will be released by the Federal Reserve Bank of New York. ----- Friday, November 15th ----- 8:30 AM: NY Fed Empire Manufacturing Survey for November. The consensus is for a reading of 5.5, up from 1.5 in October (above zero is expansion). Industrial Production 9:15 AM: The Fed is scheduled to release Industrial Production and Capacity Utilization for October. This graph shows industrial production since 1967. The consensus is for a 0.1% increase in Industrial Production, and for Capacity Utilization to be unchanged at 78.3%. 10:00 AM: Monthly Wholesale Trade: Sales and Inventories for September. The consensus is for a 0.4% increase in inventories www.calculatedriskblog.com/
|
|
|
Post by jeffolie on Nov 9, 2013 7:04:05 GMT -6
|
|
|
Post by jeffolie on Nov 9, 2013 6:32:45 GMT -6
Slowly, the industry realizes my meme that only the Type 1 rich consumer who thrive on high stock and housing for rental prices can and do become NEW CAR BUYERS. The remaining 80% which constitute the Type 2 most common Americans buy USED cars because their Real Medium Household Income has been declining from the beginning of this secular bear market which started with the peak shoulder in 1999 ... 14 years ago.
These slow to acknowledge the class warfare aspect to POLITICS AND ECONOMICS ARE 2 SIDES OF THE SAME COIN will slowly accept the political campaigning featuring class warfare against the rich that WON BIG in New York City by a 3 to 1 RATIO. Please keep in mind that my jeffolie view DOES NOT FAVOR socialism.
my jeffolie view: remains stagflation inadequately describes the 'regular depression' of Type 2 most common Americans unable to afford new cars which is why my jeffolie view applies the term screwflation. Please keep in mind that my jeffolie view DOES NOT FAVOR socialism.
|
|
|
Post by jeffolie on Nov 9, 2013 6:24:49 GMT -6
Generation Why: 2013 Even Worse For Young Car Buyers, But The Dream Is Still Alive By Derek Kreindler on November 8, 2013 A study by Edmunds on the buying habits of millennials shows that 2013 was not a particularly good year for young car buyers. Despite making good headway in 2012, 2013 saw those gains practically eroded, as a weak job market and rising home prices helped stymie any growth in market share for automotive consumers aged 18-34. The Edmunds study adds support to the two major points that Generation Why has been propagating from the start: that the lack of interest in cars among young people is largely rooted in poor economic prospects, and that their interest in the automobile goes beyond utilitarian considerationsMillennials’ car-buying patterns in 2012 and in 2013 both lend support to the theory that their weaker car-buying compared to previous generations stems from economic constraints rather than from a preference to not drive. Plus, what they bought in 2013 continues to suggest that Millennials do see cars as more than a means to get around. Even with their decreased share of overall sales in 2013, Millennials did not slack off on buying luxury and sports cars. The share of Millennial purchases from the luxury segment increased slightly. And, in every income group except the highest ($150,000 and over), aged 25-to-34 Millennials continued to buy luxury cars to a similar extent or more as older buyers with same income. Likewise, in nearly every income group, 18-to-24 year old Millennials continued to purchase a greater share of entry and midrange sports cars than the older buyers. These Millennial buying choices suggest an interest in cars that will translate into more purchases when economic conditions allow, just as in 2012.
Edmunds Chief Economist Lacey Plache raises an interesting point: new car sales among young people could continue to disappoint as the economic recovery passes them by. If this is the case, then OEMs should being to take notice. Not just that the oft-cited meme of “kids aren’t into cars” is false, but that a whole segment of the population is being systematically shut out of buying a new car. Rather than continuing to push high-content subcompact and compact cars at Generation Y, perhaps it might be time to shift gears to something simpler and more robust, but with the “cheap chic” appeal of a brand like H&M or Zara. Perhaps a brand like Mitsubishi could reinvent itself as the “frugalista” option, and borrow some product from that other fashionably cheap brand they are now in an alliance with… www.thetruthaboutcars.com/2013/11/generation-why-2013-even-worse-for-young-car-buyers-but-the-dream-is-still-alive/
|
|
|
Post by jeffolie on Nov 8, 2013 16:38:40 GMT -6
The govt number is the bad seed, black sheep born to do evil ... inspiring a false picture of the economy for the most common Americans:
|
|
|
Post by jeffolie on Nov 7, 2013 16:38:49 GMT -6
Visualizing GDP: The Consumer Is Key, But Slipping By Doug Short November 7, 2013 Note from dshort: The charts in this commentary have been updated to include the Q3 2013 Advance Estimate. The chart below is my way to visualize real GDP change since 2007. I've used a stacked column chart to segment the four major components of GDP with a dashed line overlay to show the sum of the four, which is real GDP itself. Here is the latest overview from the Bureau of Labor Statistics: The increase in real GDP in the third quarter primarily reflected positive contributions from personal consumption expenditures (PCE), private inventory investment, exports, residential fixed investment, nonresidential fixed investment, and state and local government spending that were partly offset by a negative contribution from federal government spending. Imports, which are a subtraction in the calculation of GDP, increased. The acceleration in real GDP growth in the third quarter primarily reflected a deceleration in imports and accelerations in private inventory investment and in state and local government spending that were partly offset by decelerations in exports, in nonresidential fixed investment, and in PCE. Let's take a closer look at the contributions of GDP of the four major subcomponents. My data source for this chart is the Excel file accompanying the BEA's latest GDP news release (see the links in the right column). Specifically, I used Table 2: Contributions to Percent Change in Real Gross Domestic Product. Over the time frame of this chart, the Personal Consumption Expenditures (PCE) component has shown the most consistent correlation with real GDP itself. When PCE has been positive, GDP has usually been positive, and vice versa. In the latest GDP data, the contribution of PCE came at 1.04 of the 2.85 real GDP. Although real GDP is at its highest compounded annual rate of change in six quarters, the contribution from PCE has dropped for the second consecutive quarter. Note: The conventional practice is to round GDP to one decimal place, the latest at 2.8. The 2.85 GDP in the chart above is the real GDP calculated to two decimal places based on the BEA chained 2009 dollar data series. Here is a look at the contribution changes between over the past four quarters. The difference between the two rightmost columns was addressed in the GDP summary quoted above. I've added arrows to highlight the quarter-over-quarter change for the major components. As for the role of Personal Consumption Expenditures (PCE) in GDP and how it has increased over time, here is a snapshot of the PCE-to-GDP ratio since the inception of quarterly GDP in 1947. The Q2 2013 ratio is 68.0%, fractionally off the all-time high of 68.6% in Q1 2011. From a theoretical perspective, there is a point at which personal consumption as a percent of GDP can't really go any higher. We may be approaching that level. In Q3 as Reuters comments and the table above illustrates, restocking of business inventories offset weak consumer spending. Let's hope that in Q4 consumer accelerates spending to whittle away at that growing inventory. Let's close with a look at the inverse behavior of PCE and Gross Private Investment (GPDI) during recessions (note my use of different vertical scales to facilitate the overlay). PCE generally increases as a percent of GDP whereas Private Investment declines. That is not what we're seeing in the current data. I've plotted the two with different vertical axes (PCE on left, GPDI on the right) to highlight the frequent inverse correlation. I'll update these charts when the Q3 2013 Second Estimate is released next month. advisorperspectives.com/dshort/updates/GDP-Components.php
|
|
|
Post by jeffolie on Nov 7, 2013 16:33:53 GMT -6
Yes .... a key reversal outside day ... trend change most likely for a modest decline to about DJIA 14200 +/- 250 pts within 6 weeks ... to close an existing gap & approach a 377 day moving average
|
|
|
Post by jeffolie on Nov 7, 2013 16:26:35 GMT -6
Q3 GDP - An Inventory Restocking Story By Lance Roberts of Streettalk Live November 7, 2013 The release of the first estimate of Q3 GDP was initially met with excitement as the headline print of 2.82% growth was far in excess of consensus estimates of 2.0%. Unfortunately, the euphoria quickly faded as the details painted a much more dismal story and one that I correctly pointed out on September 17th when I stated: "It has been a 'Summer of Recovery' for the U.S. economy with GDP growth rising from 1.1% in the first quarter to 2.5% in the second and manufacturing surveys showed sharp jumps in new orders and outlooks. The same occurred in the Eurozone with Markit's PMI reports showing sharp bounces higher and hopes that the recession that has plagued the region was finally coming to an end. The question of sustainability remains. I have noted several times as of late, most recently here, that the recent bumps in economic activity, particularly in the survey and sentiment data, is most likely due to short term restocking activity rather than actual economic improvement. The same goes for the recent improvements in the Eurozone data. This, of course, has been the same recovery/slowdown cycle that the economy has been trapped in ever since the end of the financial crisis as shown in the below. With each recovery has come the hope that the economy was finally set to accelerate higher; but that has yet to be the case. This has kept the Federal Reserve engaged in ongoing monetary interventions to artificially suppress interest rates, and boost asset prices, in order to pull forward future consumption to support the current economy. The problem becomes the "void" when the future arrives which requires more rounds of support." That "restocking cycle" was clearly evident in the GDP report. The chart below shows the raw change from Q2 to Q3 of the components of the GDP report. Notice the large change in private inventories. The surge in inventories was expected due to sluggish Q4 growth in 2012 and Q1 of 2013 which led to an inventory drawdown as business remained on the defensive. The last few months have seen a surge in orders and activity for manufacturers as orders were placed to restock. This bounce in activity has led to hopes that the activity will be sustained going into the end of the year, but the weakness in the underlying consumer trends brings this into question. The most recent GDP report clearly shows that the demand side of the economic equation is not only slowing domestically but internationally as both exports and imports decelerated. Furthermore, as shown in the next chart, consumer spending has continued to weaken since its peak in 2010. The last couple of quarters have shown a noticeable decline is services related spending as budgets tighten due to lack of income growth as disposable personal incomes declined in the latest report. The slowdown in dividends, wages and salaries were partially offset by a rise in social welfare and government benefits. Unfortunately, rising income derived from government benefits does not lead to stronger economic growth. The chart of real final sales below shows the underlying problem. Real final sales in the economy peaked in early 2012 and has since been on the decline despite the ongoing interventions of the Federal Reserve. The lack of transmission into the real economy is clearly evident. The current level of real final sales at 1.62% is the third straight quarter of below 2% growth. Historically, three quarters of below 2% growth in real final sales has been more consistent with economic recessions. Today’s report confirms my ongoing view that the private sector remains weak and has likely weakened further in recent months. The problem is that the "wiggle room" for the economy to absorb an exogenous shock is now razor thin. As I have discussed recently, the weakness in consumer spending and incomes bodes poorly for the upcoming holiday season. A Word About The Budget Deficit Lately, there have been numerous articles discussing the rapid decline in the budget deficit. Economists and analysts have been quick to assume that the increase in revenues, as government expenditures slowed, was a sign of a strengthening economy. The chart below shows the budget surplus/deficit from 1947 to present. Notice that real budget deficits did not occur until post 1980 as debt became the offset for weakening economic prosperity. The reality is that the surge in tax revenues was a direct result of the "fiscal cliff" at the end of 2012 as companies rushed to pay out special dividends and bonuses ahead of what was perceived to a fiscal disaster. The large surge in incomes was primarily generated at the upper end of the income brackets where individuals were impacted by higher tax rates. Those taxes were then paid in April and October of 2013 and accounted for the bulk of the surge in tax revenue to date. Also, it is important to remember that payroll taxes also increased due to the expiration of the payroll tax cut from 2010. However, the recent Q3 GDP report, and Q4, will highlight the end of income tax revenue surge as disposable income growth decelerates. This deceleration in disposable income will likely be exacerbated by sharply rising costs from the onset of the Affordable Care Act. However, the ACA is a double edged sword that leads to massive increases in government spending to support a fundamentally flawed healthcare model. It is currently estimated that by 2020 the existing government entitlement programs will consume roughly 75% of all tax revenue. The addition of another underfunded entitlement program will likely absorb the remaining share leaving only debt to fund the remaining spending needs into the future. advisorperspectives.com/dshort/guest/Lance-Roberts-131107-GDP-Inventory-Restocking.php
|
|
|
Post by jeffolie on Nov 7, 2013 15:51:42 GMT -6
Consumer Comfort Plunges To 13 Month Lows 11/07/2013 Another day, another collapse in a measure of the 'peoples' confidence. Despite the animal spirits of euphoric dot-com bubble betting that is the new-normal US equity markets, it seems both rich and poor are not loving it. Bloomberg's consumer comfort index dropped to -37.9 - its lowest since October 2012 having dropped for the 6th week in a row. The last time we saw a collapse of this size, the Fed saved us all with QE3... what this time? "they" better hope confidence comes back soon... Via Citi, Is consumer confidence set to turn? Consumer Confidence is once again following a dynamic where we see it move higher for 4 years and 4 months before beginning to collapse •Moves higher from 1996-2000 with a smaller dip halfway through in October 1998 •Moves higher from 2003-2007 with a smaller dip hallway through in October 2005 •Moves higher and so far tops out in June 2013. Also sees a small dip halfway through in October 2011. Higher yields do not help confidence... A sharp rise in mortgage rates has a negative feedback loop to consumer confidence. For those families and individuals that were now looking/able to enter the housing market, the recent spike in rates acts as a headwind. In addition to the economic backdrop, there is plenty of tail risk as we head into the end of the year. Oil prices have been rising since the summer began (and in reality since the Summer of 2012), partially due to geopolitical risks which are very much “top of mind.” A bigger spike due to a supply shock would choke the economic recovery.(In our view) In the US, the appointment of a new Fed Chairman and the upcoming budget/debt ceiling debates are likely to bring added volatility. Tapering itself can also induce concern as the “Bernanke put” is being removed from markets. In Europe, many of the structural problems related to the single currency union have not actually been addressed and the peripheral countries could still create turmoil going forward (see Fixed Income section focusing on Italy in particular for more on this). There has also been little concern with both the German elections and the German Court decision on the constitutionality of the OMT program. A surprise in either of these could be cause for concern. Emerging Markets are still not out of the woods yet as growth has been weak relative to expectations and countries with current account deficits are beginning to feel pressure in their FX and Bond markets. This is an issue we believe is only starting to develop which we will continue to expand on at later dates.(We have also looked at this in our EM FX section this week) Overall, the weak economic backdrop, poor housing recovery and potential for tail risk events over the next few months suggest that we have topped out in Consumer Confidence, a warning sign for equity markets. The relationship between Consumer Confidence is clear, and IF June did mark the high and Confidence continues to decline, then we would expect to see that translate to weakness in the equity markets. The removal of the “Bernanke put” only adds to this concern. A major turn has taken place in equity markets on average four months after Consumer Confidence turns, which would point to a decline beginning around September-October. As we have previously expressed, we remain of the bias that a correction in equity markets on the order of 20%+ is likely this year/ into 2014 and the current dynamics support such a move. Should we see a decline of that magnitude, it is almost certain that yields would move lower in a rush to safe assets www.zerohedge.com/news/2013-11-07/consumer-comfort-plunges-13-month-lows
|
|
|
Post by jeffolie on Nov 7, 2013 14:25:26 GMT -6
Some chart followers would describe todays DJIA range and movements if it closes where it is now as:
key reversal outside day
|
|
|
Post by jeffolie on Nov 7, 2013 14:05:11 GMT -6
Japanese Stocks Are Crashing As JPY Surges 11/07/2013 No one has any good answers but it seems carry is being unwound in a hurry as US momos are hammered. Whether Draghi's move shocked EURJPY riders enough to spark some major anxiety is unclear but Japanese stocks are now down over 440 points from early highs (to one month lows), US equities at their lows, and USDJPY blown back below 98.00. which is odd considering that so many went short last week... www.zerohedge.com/news/2013-11-07/japanese-stocks-are-crashing-jpy-surges
|
|
|
Post by jeffolie on Nov 7, 2013 13:47:32 GMT -6
Legal Experts: Even TOTALLY INNOCENT People Should Avoid Talking to Law Enforcement 11/07/2013 A law school professor and former criminal defense attorney explains why you should never agree to be interviewed by the police: Other criminal defense attorneys agree: As does police officer George Bruch of the Virginia Beach Police Department: We’ve previously documented that there are so many federal and state laws in the United States, that no one can keep track of them all, and everyone violates laws every day without even knowing it. As such, it is best to avoid law enforcement when possible. It’s vital to note, however, that the Supreme Court ruled this year that your silence CAN be used against you (the link is to the website of one of America’s top constitutional law professors) … at least until you’re read your Miranda rights. Therefore, if you remain silent when police are questioning you, it is very important to tell the police that you are exercising your right to remain silent. As the Atlantic notes: Basically, if you’re ever in any trouble with police… and want to keep your mouth shut, you will need to announce that you’re invoking your Fifth Amendment right instead of, you know, just keeping your mouth shut. “Petitioner’s Fifth Amendment claim fails because he did not expressly invoke the privilege against self-incrimination in response to the officer’s question,” reads the [Supreme Court] opinion …. It’s Not Andy Griffith’s America Any More This is not to say that all law enforcement personnel are bad folks. Many of them are outstanding people. But our police forces have become so insanely militarized and the fear of terror has become so wildly overblown that many law enforcement personnel have become hair-trigger tense. People have been severely harassed when they’ve asked for help from law enforcement. For example, an anti-war website was spied on for 6 years after they asked for help by the FBI. And the FBI rifled through all of a woman’s electronic communications after she told the FBI that she was being harassed. Police have recently tasered numerous deaf or retarded people for “failing to follow orders”. And they’ve shot and killed people who were just looking for help. See this and this. Again, we’re not trying to paint with a broad brush; most law enforcement personnel are good folks just trying to do their job. And police are human, too … sometimes they get scared and overreact. But it’s not the same ole Andy Griffith show type demeanor among law enforcement today. So it’s best to be careful. www.zerohedge.com/contributed/2013-11-07/legal-experts-even-totally-innocent-people-should-avoid-talking-law-enforceme
|
|
|
Post by jeffolie on Nov 7, 2013 13:35:28 GMT -6
Bank of Spain "Discovers" €20.50 Billion in Hidden Non-Performing Loans; Bank of Spain Translated 11/7/2013 Via translation, El Economista reports the Bank of Spain Discovers €20.50 Billion Hidden Delinquencies. Emphasis on the word "discovers" not added. Non-performing loans of Spanish banks to the end of September totaled €92.224 billion euros, 29% more than the €71.660 billion according to preliminary data included in the last Bulletin Financial Bank of Spain. The Bank of Spain urged banks to review loan portfolios before the September 30 deadline. [Mish note: Once again, emphasis is not added, this time in bold] The document published today reveals that all segments of activity shows the same pattern as before. In general, institutions have shown a high recognition of credit risk deterioration. Late payments in June rose to 11.9%, from 10% the previous year, and thereafter continued to rise, reaching 12% in August. The same report notes that Spanish banks have a loss absorption capacity that exceeds €28.600 billion expected in the worst case scenario described by the Bank of Spain until 2015. Bank of Spain Warns Against "Destabilizing Effects" Bail-In Given that "hidden" losses were much greater than expected (except of course in this corner), it should not be surprising to see this headline: Bank of Spain Warns Preemptive Rescue of Banks May Have "Destabilizing Effects" Once again via translation from El Economista. The governor of the Bank of Spain, Luis Maria Linde, warned today about the destabilization that may involve too hasty implementation of a preemptive "bail-in" rescue of nonviable financial institutions. Linde believes that too much advance application of acquittals to senior debt can have "potentially destabilizing" effects. Bank of Spain Translated "Banks lied. No, strike that. We mean to say conditions unexpectedly deteriorated. And who couldda possibly thunk that? Smelly stuff happens. Don't worry, we will preemptively sniff deeper next time, and with a bigger nose. We promise! But the safe thing to do now (as always) is protect senior bondholders. Rest assured, there will be no bail-ins until we are 100% certain senior bondholders don't need to be bailed in." Mike "Mish" Shedlock globaleconomicanalysis.blogspot.com/
|
|
|
Post by jeffolie on Nov 7, 2013 13:27:15 GMT -6
November 07, 2013 Euro Swings Significantly, Gold Dips Following ECB Rate Cut Announcement; US Tapering Coming Up? Here is a 10-minute Euro chart that shows wild swings following the Unexpected ECB Decision to lower rates today. 10-minute Euro Chart The Euro swung 2 cents vs. the US dollar but has now regained about half of the move.On a percentage basis, these are substantial swings. 10-minute Gold Chart Charts from Barchart. Gold fell about $30 following the ECB announcement and has taken back about a third of the decline. US Tapering Coming Up? Is competitive currency debasement bad for gold? It shouldn't be. Likely, this is more of an over-reaction to the still-lingering belief that the Fed is going to taper. How likely is that? Not very according to Bloomberg columnist Caroline Baum in her article today A GDP Report in Search of Liftoff While real GDP increased 2.8 percent in the third quarter, inventories accounted for almost a third of the growth. Consumer spending added 1 percentage point and net exports 0.3 percentage point. Real final sales, which is GDP less inventories, rose 2 percent, close to the trend since the recession ended in June 2009. Final sales to domestic purchasers, which excludes exports and includes imports, rose a meager 1.7 percent.
So there you have it. Almost five years of zero-percent interest rates, about $3 trillion of asset purchases by the Federal Reserve and lots of forward guidance on both, and the U.S. economy still can't get out of its own way. Whatever else the Fed decides, tapering asset purchases isn't in the cards any time soon. Should vs. Will are Horses of a Different Color Given the huge asset bubbles in equities and corporate bonds, the Fed ought to be tapering now. Then again, given that repetitive bubble blowing never makes any sense, the Fed should never have launched three rounds of QE in the first place. But what the Fed "should" do and what the Fed "will" do are horses of a different color. Baum is highly likely correct in her assertion "tapering asset purchases isn't in the cards any time soon." Mike "Mish" Shedlock globaleconomicanalysis.blogspot.com/
|
|
|
Post by jeffolie on Nov 7, 2013 13:20:27 GMT -6
King Dollar breaks out, as Draghi/European banks lower interest rates! 11/07/2013 Recently King Dollar found it self on multi-year support, created a bullish falling wedge and very few investors were bullish the U.S. Dollar. This was a set up for a rally in King Dollar! The Power of the Pattern and Joe Friday highlighted set up for a Dollar rally about couple of weeks ago (HERE) With Europe lowering interest rates, is Draghi expressing/confirming a concern for "Disinflation or Deflation?" Just last week Joe Friday and the Power of the Pattern reflected breakdowns in key commodities and the Deflation/Disinflation theme. (Here) Could this breakdown is some key commodities have been an influence on Europe to lower rates??? blog.kimblechartingsolutions.com/
|
|
|
Post by jeffolie on Nov 7, 2013 12:42:31 GMT -6
Nov. 6, 2013 Why China may change forever this weekend LOS ANGELES (MarketWatch) — OK, see if you can read the following sentence without falling asleep: On Saturday, the Third Plenary Session of the 18th Central Committee of the Communist Party of China will begin its four-day meeting. Sounds wildly boring to be sure, but this meeting — known popularly by the snappy name “Third Plenum” — could be the biggest thing to happen to China in decades. And given that China is now the world’s second-largest economy, that its fortunes have a major impact on U.S. corporations, and that some economists say China is on the brink of a potential economic crisis with world-shattering implications, it couldn’t hurt to take a look at what the Third Plenum is all about. A plenum is just a meeting of China’s top Communist Party brass, and they usually hold one or two a year over the five-year term of the Central Committee, basically the party’s leadership. Most of these meetings mean very little if you’re not a member of China’s government, but the Third Plenum … that’s a different story. Economists and news reports are quick to point out that the Third Plenum of each term — especially following a leadership change — is when all the reforms are rolled out in one gigantic flood of policy changes. At the Third Plenum held in 1978, China’s new leader Deng Xiaoping basically abandoned traditional Communism in favor of a “Reform and Opening” policy. At the Third Plenum in 1993, Deng’s successor Jiang Zemin went further, launching China’s “socialist market economy” which led to the nation joining the world economy in earnest. So what’s in store for this year’s event? Will President Xi Jinping, who took power last year, take reform a step (or several steps) further? The early indications are yes, he will. While hundreds of cadres will attend the Plenum, the real decisions are made by a much smaller group, and we won’t know for sure what’s in the works until President Xi delivers the Third Plenum’s “working report” sometime before the gathering closes on Nov. 12. But some possible details are already out. Late last month, a key advisory committee issued the “3-8-3 Plan” of suggested reforms. (China loves to put numbers in titles: the “5-4 Movement,” the “7-7 Incident,” etc.) The plan’s name is shorthand for “3 areas of reform, 8 sectors to reform, and 3 major reform breakthroughs — see this Caixin report for more details. Much of what was released is pretty vague, but it and a few other clues listed below suggest major changes are afoot. Or as Barclays economist Jian Chang put it in a note out last week, the 3-8-3 Plan “has exceeded general market expectations.” As it stands, here’s a sample of some possible measures that may come out of the meeting: Interest rates and the housing bubble China is famous for its housing bubble. With interest rates on savings so low, real estate is a very popular investment option for those with funds, sometimes resulting in “ghost housing developments” where the owners sit on uninhabited investment properties as they wait for prices to rise. The government is of course concerned, having launched a long series of curbs on the property market in recent years, but until the banking sector — dominated by the big state-owned players — offer a viable investment alternative, the housing bubble may remain a growing danger to China’s economic future. Enter People’s Bank of China Gov. Zhou Xiaochuan. The Wall Street Journal reported this week that the central-bank chief shockingly lambasted party leaders late last year over the need to provide depositors with higher interest rates and to open up the financial system to more competition. Rather than having Zhou drummed out of office, President Xi reportedly reappointed him to his post and called him “a talent who can be counted on.” Social Security Of the three “breakthroughs” that make up the final “3” in the 3-8-3 Plan, one of the most intriguing is the idea of a “social security” system. Here, social security refers not necessarily to government funds for the elderly, but more likely an improvement in public health care, according to Barclays’s Jian Chang, who sees such a move as likely to show significant progress by 2015. Click to Play Why China needs to kick the luxury habitDespite Xi Jinping’s clampdown on corruption and opulent displays of wealth, China’s cities still want to attract wealthy residents. China World columnist Andrew Browne discusses why this explosion of luxury in China needs to change. Despite being run by communists, China has little of the social safety net found in many Western nations, and for anyone worried about social stability in the nation, this reform is actually pretty important. ‘One-child policy’ China’s famous limit of one child per couple has long been dying a slow death, with exceptions and outright flouting of the law not uncommon (See this MarketWatch report from 2010 on the inevitable end of the one-child policy.) With the rapid aging of the Chinese population, some sort of liberalization is clearly needed. Still, many reports say the Plenum will result in a further relaxation of the policy, rather than outright repeal. Going green The 3-8-3 Plan makes fleeting mention of pursuing green development, and the environment is certainly a huge concern for a country where, for example, rampant smog caused an eight-year-old girl to develop lung cancer. Even in Beijing, where the nation’s leaders live and work, severe toxic pollution is a fact of life. Here though, progress looks less likely, in part due to government inefficiencies. (See this report on the government’s difficulties in tackling a water-pollution crisis.) Economic slowdown? Something NOT on the agenda for the Plenum is engineering a further slowdown for the economy. However, as Barclays points out, this is often the result when big changes surface from a Third Plenum reform binge. Such was the case after the 1978 and 1993 meetings. This, Jian Chang writes, “reflects the fact that structural reforms, while good for the longer term, tend to slow growth in the short term.” Well, no gain without pain perhaps www.marketwatch.com/story/why-china-may-change-forever-this-weekend-2013-11-06
|
|
|
Post by jeffolie on Nov 7, 2013 9:07:17 GMT -6
Commerce Department report indicates the economy is losing momentum November 7, 2013 WASHINGTON -- On the surface, the U.S. economy looked good in the third quarter, with the pace of growth improving to a surprisingly solid 2.8% annual rate, the fastest in a year. But the details of the report, released Thursday by the Commerce Department, painted a picture of a recovery actually losing momentum -- a worrisome sign for near-term job and income gains as the fourth quarter is likely to come in weak. The report showed consumer and business spending, two critical drivers of the economy, slowed in the three months ended September. While purchases of cars and food picked up in the third quarter, spending on services dropped sharply, particularly related to housing and utilities. Overall, personal consumption growth weakened to a 1.5% pace, from 1.8% in the second quarter. Business investment, meanwhile, increased by just 1.4%, down from a 4.7% gain in the previous quarter. Residential investment was a bright spot, but it wasn't enough to make up for a big drop in spending for information processing and other equipment. "Business sits on new investment projects, unwilling to give them a green light unless final demand picks up," said Kathy Bostjancic, an economist at the Conference Board. She called the report disappointing. The overall rate of economic growth, however, quickened in the third quarter from 2.5% in the second quarter, thanks in good part to an unexpectedly large stockpiling of goods. Inventory gains in one quarter, though, tend to have a reverse effect in the next quarter, as companies don't need to stock up as much after a big buildup. That suggests economic growth in the fourth quarter, already weakened by the partial federal government shutdown, could come in lower than current forecasts of less than 2%. "As businesses try to reduce excess inventories, economic growth will decelerate during the final quarter of this year," said Sung Won Sohn, an economist at Cal State Channel Islands. "Business investment has fallen largely due to uncertainties in the economy, some of which is coming from Washington." Sohn added that the Federal Reserve had made the right decision in delaying a reduction of its large bond-buying stimulus program.
Thursday's economic report, on the positive side, showed the drag from government spending cuts had eased. Spending by state and local governments edged higher, reflecting a rebound in tax revenue, analysts said. Trade also provided a boost to overall growth in the third quarter. Many economists are expecting the fourth quarter numbers to be weakened by the 16-day government shutdown in October. Slower economic growth means less hiring by companies and thus smaller income gains for consumer spending. Job growth has weakened in recent months. The Labor Department on Friday will report October's employment and unemployment figures. www.latimes.com/business/money/la-fi-mo-economy-third-quarter-gdp-20131107,0,922111.story#axzz2jyInj9mX
|
|
|
Post by jeffolie on Nov 7, 2013 8:18:53 GMT -6
If it walks like a duck ... looks to me to be a planned set of actions, unless you believe in coincidence
Coordinated action:
At the same time that the US GDP jumped up, the Eurotrash threatened deflation dumped their equivalent to our FED funds rate to a record low .25% ... algos read this activity and reacted in nanoseconds jumping US assets such as the dollar index, stocks, bond values(lowering rates, yields)
|
|
|
Post by jeffolie on Nov 7, 2013 7:39:55 GMT -6
Nov. 7, 2013, 8:31 a.m. EST
U.S. third-quarter GDP climbs 2.8%
WASHINGTON (MarketWatch) - The U.S. expanded by a 2.8% annual pace in the third quarter, the biggest increase in a year and a half, aided by a large buildup in business inventories and an improved trade picture, the government said Thursday. Economists polled by MarketWatch had forecast 2.3% growth. Yet consumer spending, the main engine of the U.S. economy, slowed to a 1.5% increase from 1.8% in the second quarter, indicating the economy entered the fourth quarter with little momentum. Business investment also weakened, up just 1.6% vs. a 4.7% gain in the second quarter. And federal spending fell for the fourth straight quarter, down 1.7%. On the positive side, investment in the housing sector remained strong with a 14.6% increase and exports outpaced imports. Exports rose 4.6% vs. a preliminary 1.9% increase in imports. Business inventories, meanwhile, jumped by $86 billion in the third quarter, as companies restocked warehouse shelves at the fastest rate in six quarters. Such a large buildup, however, could be partly unwound in the final three months of 2013 and act as a drag on growth. Inflation as measured by the PCE index increased at a 1.9% annual rate and the core rate that excludes food and energy rose by 1.4%.
|
|