|
|
Post by jeffolie on Dec 5, 2012 16:30:21 GMT -6
Bank stocks lead or decline?  www.ritholtz.com/blog/wp-content/uploads/2012/12/kbw.gif www.ritholtz.com/blog/wp-content/uploads/2012/12/kbw.gif " Virtually all severe stock market setbacks are preceded by underperformance of financial stocks, and the selloff tends to continue until the financials start to outperform. 1987 was a classic example of this phenomenon. The sharp underperformance of the NYSE Financials was the warning of coming horrors. ... Regrettably, the NYSE Financials Index was discontinued some years ago; it had a nearly perfect warning record. Its successor, the Philadelphia Banking Index (in place since Aug 1994), stockcharts.com/h-sc/ui?s=$BKX&p=D&b=1&g=0&id=p32331465551 seems to have filled its shoes admirably." ============================= [ from Bart's site www.nowandfutures.com ] Dow Jones Industrial Average prediction Our prediction is based on the inflation definition of "more money than goods" and therefore when more money is created (or people think its being created) than goods, it goes into things like financial assets or real estate. For the prediction below, we use many different money measures from the Federal Reserve, and then add a varying time lag since it takes time for the money to get fully into the economy after it has been created. Also Donald Coxe, US Portfolio Strategist within the Research Department of BMO Nesbitt Burns, had this to say in early April 2005: " Virtually all severe stock market setbacks are preceded by underperformance of financial stocks, and the selloff tends to continue until the financials start to outperform. 1987 was a classic example of this phenomenon. The sharp underperformance of the NYSE Financials was the warning of coming horrors. ... Regrettably, the NYSE Financials Index was discontinued some years ago; it had a nearly perfect warning record. Its successor, the Philadelphia Banking Index (in place since Aug 1994), stockcharts.com/h-sc/ui?s=$BKX&p=D&b=1&g=0&id=p32331465551 seems to have filled its shoes admirably." www.nowandfutures.com/forecast.html#predict_dow |
|
|
|
Post by jeffolie on Dec 26, 2012 18:34:46 GMT -6
 blog.kimblechartingsolutions.com/wp-content/uploads/2012/12/bankspull500higherdec26.gif blog.kimblechartingsolutions.com/wp-content/uploads/2012/12/bankspull500higherdec26.gifBanks had much to do with the broad markets decline during 2007 to 2009, as the Bank Index (BKX) lost over 80% of its value. In 2012, the inset chart reflects that the BKX index gained almost twice as much as the 500 index. Over the last three years, the Bank Index could be forming a bullish inverse head & shoulders pattern. The potential neckline (1) continues to be important falling resistance since 2010. If the pattern read happens to be correct, a break of the neckline would be a positive for the index and the broad market. Will Banks pull the broad market higher in 2013? I would want to own them if a breakout takes place! blog.kimblechartingsolutions.com/ |
|
|
|
Post by jeffolie on Jan 8, 2013 12:27:55 GMT -6
|
|
|
|
Post by jeffolie on Jan 29, 2013 12:36:44 GMT -6
Confidence in the debt of BANKS, FINANCIAL has almost RETURNED TO THE PEAK 2007 LEVELSmy jeffolie view: a stock market topping process most likely will begin as my prediction for the S&P to reach 1565 as early as March and/or through the sell in May period... the banks, financials again are reaching areas similar to those in this secular bear market top of trading ranges from the beginning of the secular bear markets long sideways trading range from 1999 to today with another down leg to follow. www.ritholtz.com/blog/wp-content/uploads/2013/01/bond-rotation.jpg www.ritholtz.com/blog/wp-content/uploads/2013/01/bond-rotation.jpg
|
|
|
|
Post by jeffolie on Feb 12, 2013 10:40:19 GMT -6
|
|
|
|
Post by jeffolie on Feb 12, 2013 11:24:26 GMT -6
bart posted: .... "If it weren't for increasing POMOs and SecLend operations, the BKX would have broken down by now. I do have bearish signals on 3 of 9 of my main topping indicators though, one of which is Primary Dealer positions. 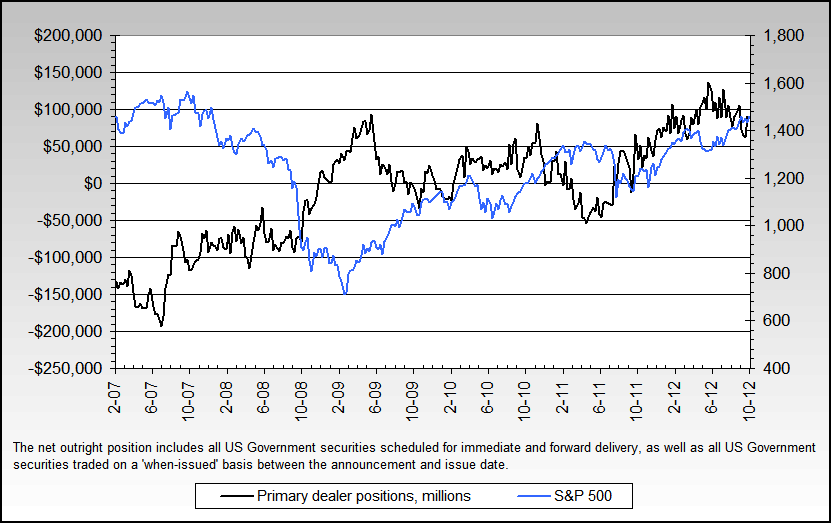 |
|
|
|
Post by jeffolie on Apr 22, 2013 10:23:49 GMT -6
Bank Stocks Face Technical Resistance by Barry Ritholtz - April 22nd, 2013 Stephen Suttmeier of Merrill Lynch writes: “Given the recent pullback in bank stocks (2.5% down since reporting season started), we decided to take a look at how the bank indices stack up from a technical standpoint, given few fundamental catalysts that we see near term. Both the banks and the broader financials sector continue to test the major or secular resistance at prior lows from 2002, 2003, 2000 and 1998 – which is proving to be an important barrier so far in 2013. This resistance is 230-270 on the S&P 500. Financials (at 243 currently) and 54-65 on the BKX (at 55 currently). The KRX (currently at 59) briefly pushed above resistance at the prior lows from 2002-2003 at 56-61, but has since pulled back and has not sustained the move higher. The S&P 500 Financials Index & KRX both achieved new recovery highs in the cyclical bull market from March 2009, but the BKX has not confirmed this move & is below its April 2010 recovery high of 58-59. The lack of a new recovery high in the BKX is a negative divergence for the sector.” I have been biased against the major money center banks ever since the financial collapse; my problem with the banks has been their opaque earnings reporting and off-balance sheet liabilities. The technicals are simply another reason to be wary ![]() www.ritholtz.com/blog/wp-content/uploads/2013/04/char-tof-the-week.jpg www.ritholtz.com/blog/wp-content/uploads/2013/04/char-tof-the-week.jpg [/img] www.ritholtz.com/blog/wp-content/uploads/2013/04/char-tof-the-week.jpg Source: Will bank stocks continue to grind lower? Erika Penala, Stephen Suttmeier, Ebrahim H. Poonawala, Katherine Lin, Kevin Senet Merrill Lynch April 21, 2013 www.ritholtz.com/blog/2013/04/bank-stocks-face-technical-resistance/ |
|
|
|
Post by jeffolie on May 16, 2013 9:07:15 GMT -6
Bank stocks lead or decline? www.ritholtz.com/blog/wp-content/uploads/2012/12/kbw.gif " Virtually all severe stock market setbacks are preceded by underperformance of financial stocks, and the selloff tends to continue until the financials start to outperform. 1987 was a classic example of this phenomenon. The sharp underperformance of the NYSE Financials was the warning of coming horrors. ... Regrettably, the NYSE Financials Index was discontinued some years ago; it had a nearly perfect warning record. Its successor, the Philadelphia Banking Index (in place since Aug 1994), stockcharts.com/h-sc/ui?s=$BKX&p=D&b=1&g=0&id=p32331465551 seems to have filled its shoes admirably." ============================= [ from Bart's site www.nowandfutures.com ] Dow Jones Industrial Average prediction Our prediction is based on the inflation definition of "more money than goods" and therefore when more money is created (or people think its being created) than goods, it goes into things like financial assets or real estate. For the prediction below, we use many different money measures from the Federal Reserve, and then add a varying time lag since it takes time for the money to get fully into the economy after it has been created. Also Donald Coxe, US Portfolio Strategist within the Research Department of BMO Nesbitt Burns, had this to say in early April 2005: " Virtually all severe stock market setbacks are preceded by underperformance of financial stocks, and the selloff tends to continue until the financials start to outperform. 1987 was a classic example of this phenomenon. The sharp underperformance of the NYSE Financials was the warning of coming horrors. ... Regrettably, the NYSE Financials Index was discontinued some years ago; it had a nearly perfect warning record. Its successor, the Philadelphia Banking Index (in place since Aug 1994), stockcharts.com/h-sc/ui?s=$BKX&p=D&b=1&g=0&id=p32331465551 seems to have filled its shoes admirably." www.nowandfutures.com/forecast.html#predict_dowFinancials break dual resistance…next key level 11% higher- Posted by Chris Kimble on 05/16/2013  blog.kimblechartingsolutions.com/wp-content/uploads/2013/05/xlfbreaks38andchannelresistancemay161.jpg blog.kimblechartingsolutions.com/wp-content/uploads/2013/05/xlfbreaks38andchannelresistancemay161.jpgSo Goes the Banks, So goes the broad market? In 2007-2008, Financial stocks were a key contributor to the broad markets downside action, as XLF declined over 80% with the S&P 500 losing half its value. Since the 2009 lows, financials have reflected a good deal of relative strength, out pacing the S&P 500 by a good margin (100%) . In the past two weeks XLF has broken above a rising channel and its 38% fibonacci retracement level at the same time. A positive for financial stocks and the broad market. A key price point to watch for the financials comes into play at its 50% retracement level of the financial crisis, which comes into play around 11% above current prices!blog.kimblechartingsolutions.com/2013/05/financials-break-dual-resistance-next-key-level-11-higher/ |
|
|
|
Post by jeffolie on May 20, 2013 12:25:53 GMT -6
Bank stocks lead or decline? www.ritholtz.com/blog/wp-content/uploads/2012/12/kbw.gif " Virtually all severe stock market setbacks are preceded by underperformance of financial stocks, and the selloff tends to continue until the financials start to outperform. 1987 was a classic example of this phenomenon. The sharp underperformance of the NYSE Financials was the warning of coming horrors. ... Regrettably, the NYSE Financials Index was discontinued some years ago; it had a nearly perfect warning record. Its successor, the Philadelphia Banking Index (in place since Aug 1994), stockcharts.com/h-sc/ui?s=$BKX&p=D&b=1&g=0&id=p32331465551 seems to have filled its shoes admirably." ============================= [ from Bart's site www.nowandfutures.com ] Dow Jones Industrial Average prediction Our prediction is based on the inflation definition of "more money than goods" and therefore when more money is created (or people think its being created) than goods, it goes into things like financial assets or real estate. For the prediction below, we use many different money measures from the Federal Reserve, and then add a varying time lag since it takes time for the money to get fully into the economy after it has been created. Also Donald Coxe, US Portfolio Strategist within the Research Department of BMO Nesbitt Burns, had this to say in early April 2005: " Virtually all severe stock market setbacks are preceded by underperformance of financial stocks, and the selloff tends to continue until the financials start to outperform. 1987 was a classic example of this phenomenon. The sharp underperformance of the NYSE Financials was the warning of coming horrors. ... Regrettably, the NYSE Financials Index was discontinued some years ago; it had a nearly perfect warning record. Its successor, the Philadelphia Banking Index (in place since Aug 1994), stockcharts.com/h-sc/ui?s=$BKX&p=D&b=1&g=0&id=p32331465551 seems to have filled its shoes admirably." www.nowandfutures.com/forecast.html#predict_dowFinancials break dual resistance…next key level 11% higher- Posted by Chris Kimble on 05/16/2013 blog.kimblechartingsolutions.com/wp-content/uploads/2013/05/xlfbreaks38andchannelresistancemay161.jpgSo Goes the Banks, So goes the broad market? In 2007-2008, Financial stocks were a key contributor to the broad markets downside action, as XLF declined over 80% with the S&P 500 losing half its value. Since the 2009 lows, financials have reflected a good deal of relative strength, out pacing the S&P 500 by a good margin (100%) . In the past two weeks XLF has broken above a rising channel and its 38% fibonacci retracement level at the same time. A positive for financial stocks and the broad market. A key price point to watch for the financials comes into play at its 50% retracement level of the financial crisis, which comes into play around 11% above current prices!blog.kimblechartingsolutions.com/2013/05/financials-break-dual-resistance-next-key-level-11-higher/Can Dr. Ben push Banks & Real Estate 12% higher? Posted by Chris Kimble on 05/20/2013  blog.kimblechartingsolutions.com/wp-content/uploads/2013/05/bankrealestatedrbenoperationmay20.jpg blog.kimblechartingsolutions.com/wp-content/uploads/2013/05/bankrealestatedrbenoperationmay20.jpgBanks & Home builders lost nearly 80% in value at the 2009 lows. Dr Ben has doing a variety of "operations" to get these sectors back to health. Both Banks and Home builders faced the 38% Fibonacci retracement level of late, a key resistance recovery line that both have pushed above in the past couple of weeks, a positive technical development. These leading sectors face two big tests in the upcoming weeks. Can they stay above the new 38% support level and can Dr Ben nurse them back to health, by reaching the half way point, the 50% Fibonacci level of the 2007-2009 Financial crisis declines? Dr Ben is doing his best tricks in the operating room to nurse these sectors back to health. Can he push them 10%+ higher in the upcoming weeks? Stay tuned and keep a close eye on them! blog.kimblechartingsolutions.com/2013/05/can-dr-ben-push-banks-real-estate-12-higher/ |
|


