|
|
Post by unlawflcombatnt on Mar 2, 2006 16:53:17 GMT -6
Below is a copy of a page from the Federal Reserve website showing the latest M3 money supply numbers. 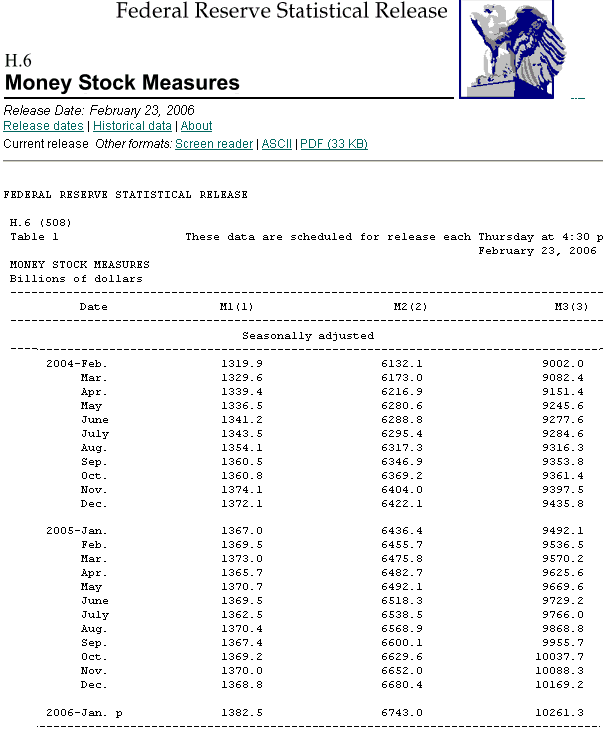 Here's a link the site Federal Reserve - M3Here's a link to the pdf file on this information: Fed Reserve M3 pdfI recommend that readers copy this information down, and download the pdf file to your computers. When these numbers cease to be published, these files will probably disappear from the internet. |
|
|
|
Post by lc on Mar 2, 2006 21:58:43 GMT -6
Those numbers indicate a 5% programmed inflation rate over the last two years.
I still think there is more capital creation in instruments like interest rate swaps interbank. But their own numbers detail 5% inflation.
|
|
|
|
Post by unlawflcombatnt on Mar 2, 2006 23:00:12 GMT -6
Would capital creation instruments expand the money supply beyond the total M3?
|
|
|
|
Post by lc on Mar 3, 2006 10:05:33 GMT -6
n
|
|
|
|
Post by unlawflcombatnt on Mar 3, 2006 15:48:47 GMT -6
LC, Thanks for your input. I think I recently read an article mentioning $400 trillion in total world derivatives, but I'm not sure. I'll try to find it. I'm gathering, however, from your post and other research, that M3 money supply grossly understates total spendable wealth in existence. If spendable wealth can be extracted from the derivatives market, it seems it would greatly expand the functional money supply. Again, I'm not clear on anything related to derivatives. (Just thinking about "derivatives" makes my eyes roll around in their sockets.   ) |
|
|
|
Post by lc on Mar 3, 2006 16:50:50 GMT -6
n
|
|
|
|
Post by lc on Mar 4, 2006 21:55:43 GMT -6
n
|
|
|
|
Post by unlawflcombatnt on Mar 5, 2006 3:11:10 GMT -6
LC,
So the Fed's going to put more money into circulation one way or another. They're either going to print more, or they're going to buy assets or bonds with money they already have, putting that money into circulation. I think I'm going to stick to gold. Maybe they'll start buying that, and help drive the price up even further.
Could you elaborate a little more on interest rate swaps?
|
|
|
|
Post by lc on Mar 5, 2006 12:12:15 GMT -6
n
|
|
|
|
Post by lc on Mar 5, 2006 14:40:08 GMT -6
n
|
|
|
|
Post by unlawflcombatnt on Mar 6, 2006 14:07:28 GMT -6
LC,
Thanks for the links and the interpretation. I'll have to read this a few times before I comment. It's pretty confusing, as well as being very worrisome.
I'll also see if there's any direct commentary on this by Steven Roach, since he was mentioned in the article. He's another economist who I have great respect for. I'm going to post one of his links later regarding the wage-productivity gap.
|
|
|
|
Post by unlawflcombatnt on Mar 8, 2006 12:39:08 GMT -6
The "carry trade" - as it is known - is a near limitless cash machine for banks and hedge funds. They can borrow at near zero interest rates in Japan, or 1pc in Switzerland, to re-lend anywhere in the world that offers higher yields, whether Argentine notes or US mortgage securities. Arguably, it has prolonged asset bubbles everywhere, blunting the efforts of the US and other central banks to restrain over-heating in their own countries. The Bank of International Settlements last year estimated the turnover in exchange and interest rates derivatives markets at $2,400bn a day. "The carry trade has pervaded every single instrument imaginable, credit spreads, bond spreads: everything is poisoned," said David Bloom, currency analyst at HSBC. [/i] 2.4 trillion dollar/day volumes in exchange rates and interest rates derivatives. That is the annual GDP of the US every 5 days. Makes the US look pretty small compared to just one bubbled market in a sea of ten such institutions. Hell the GDP of the planet gets traded every two weeks in just two markets... There is way too much money in circulation that has nothing to do with trade or the real economy. [/quote] LC, After reading this, I understand why you previously suggested I over-emphasize the importance of (consumer) demand. Spendable wealth is simply being created out of thin air. There is little to limit this wealth creation. And this artificial wealth creation can't help but cause global currency devaluation. It still appears, however, that a relatively small amount of the artificial wealth created trickles down to consumers. As the super-affluent devalue the currency through artificial wealth creation, they truly are causing an upward shift in wealth distribution. They're increasing their wealth by artificially increasing their own holdings of wealth. In turn, this devalues the dollar, as well as the inflation-adjusted value of everyone else's holdings. This credit expansion is truly a mechanism for shifting wealth upward. The less affluent aren't able to "create" dollars the way international bankers and financiers can. So the rich get richer while the poor get poorer. And our economy moves still closer to the cliff. |
|
|
|
Post by lc on Mar 8, 2006 14:35:51 GMT -6
n
|
|
|
|
Post by unlawflcombatnt on Mar 9, 2006 15:01:06 GMT -6
LC,
I see your point. Those that have the most in artificial paper wealth (at present) could convert that artificial wealth into tangible assets, thus causing a true shift in real wealth.
I've tactfully encouraged people to invest in gold (or other precious metals) to avoid the devaluation of their own paper assets by inflation/over-valuation.
I think housing is a more tenuous investment than direct land investment. However, I think even land is in true abundance. But there may be an effective shortage, due to large holdings by a small number of parties. I think that truly is the case in Southern California.
I do own some land myself. However, I'm not primarily holding it for investment. It's mainly so that I'll have a place to live eventually (with a lot of space.) I'd certainly consider selling if the selling price rose astronomically. However, I'm not anticipating that happening.
|
|
|
|
Post by unlawflcombatnt on Mar 9, 2006 16:00:44 GMT -6
Below is a graph of M3. In all fairness to the current president, the M3 supply increase started accelerating under Clinton. However, GDP growth was also increasing, and annual budget deficits were decreasing. Under Bush, despite the decline in GDP growth during the first part of his presidency, M3 continued its rapid increase.
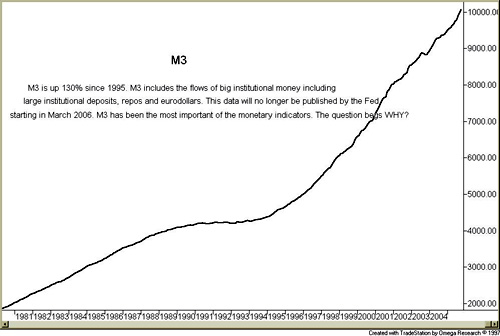
I thought I should add a shorter term graph that I found at another site. It's interesting to note that M3 didn't grow much during Clinton's 1st term. Then it started taking off. Also of interest is that there was no slowdown in that growth during the 2001 recession, or during any of the tepid pseudo-recovery that followed. Given that M3 should increase at the same rate of GDP growth, this implies an obvious overexpansion of the money supply.
Below is another graph of M3 growth, starting with 1990:

|
|
|
|
Post by lc on Mar 10, 2006 21:04:48 GMT -6
n
|
|
|
|
Post by unlawflcombatnt on Mar 11, 2006 0:01:48 GMT -6
LC,
That's an interesting observation. From December 2005 to January 2006, the increase was $92 billion. From November to December 2005 it was $89 billion. Looking at earlier months, it seems to be running between $80-100 billion/month. That puts it at about $3 billion/day.
From January 2005 to January 2006, the total was $769 billion. That number bears a striking similarity to our trade deficit number.
|
|
|
|
Post by Pablo on Mar 24, 2006 20:06:06 GMT -6
hi!. on derivatives dont know much about it....i just know we need to see, if GM goes bankrupt. In that case the derivative house will start to show it hands .................................................................................................................................................. How A Formula Ignited Market That Burned Some Big Investors (From THE WALL STREET JOURNAL) By Mark Whitehouse When a credit agency downgraded General Motors Corp.'s debt in May, the auto maker's securities sank. But it wasn't just holders of GM shares and bonds who felt the pain. Like the proverbial flap of a butterfly's wings rippling into a tornado, GM's woes caused hedge funds around the world to lose hundreds of millions of dollars in other investments on behalf of wealthy individuals, institutions like university endowments -- and, via pension funds, regular folk. www.jsmineset.com/ARhome.asp?VAfg=1&RQ=EDL,1&AR_T=1&GID=&linkid=3120&T_ARID=3150&cTID=-1&cCat=&PRID=-1&cSubCat=&archive=&highstr=DERIVATIVES&UArts= |
|
|
|
Post by unlawflcombatnt on Mar 24, 2006 21:40:40 GMT -6
Now that M3 has been phased out, it's worth demonstrating the kind of information that is being covered up by this change. Below is a copy of the last year's M3 numbers. 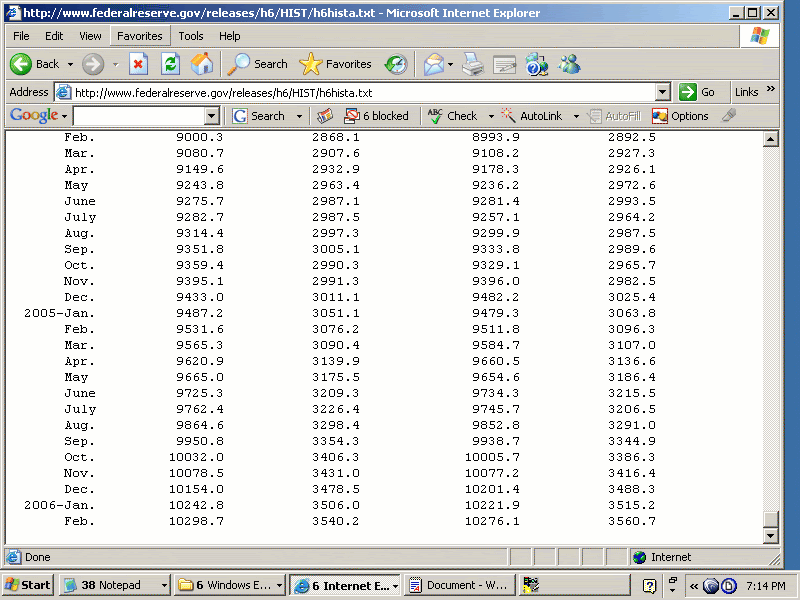 In December 2005, the total M3 supply was $9.433 trillion. In December of 2006, it had risen to $10.154 trillion. This is an increase of $0.721 trillion, or 7.6%. In contrast, our real GDP increase was only $384 billion, or 3.2%. Some financial analysts, by convention, compute the true inflation rate by subtracting the GDP increase from the M3 money supply increase. Thus, inflation would be 7.6% - 3.2% = 4.4%. However, the government's calculated consumer price index only increased from 190.3 in December 2005 to 196.8 in December 2006. The consumer price index indicates an increase in inflation of 3.4%, not 4.4%. This is the kind of information the Fed will effective obscure by not publishing M3 numbers in the future. The government's ability to lie to us will be further enhanced by squelching the publication of M3 numbers. The latest M3 information can still be found at the Federal Reserve link below; www.federalreserve.gov/releases/h6/HIST/h6hista.txt |
|
|
|
Post by unlawflcombatnt on May 14, 2006 13:34:36 GMT -6
I managed to copy the following graph from a British Gold Investment site. It shows the change in the Consumer Price Index vs. the M3 money supply. It's interesting to note how the M3 supply began diverging from the CPI around 1996. Apparently there was a change in how the Consumer Price Index was calculated in 1996. Do you suppose there's a connection? 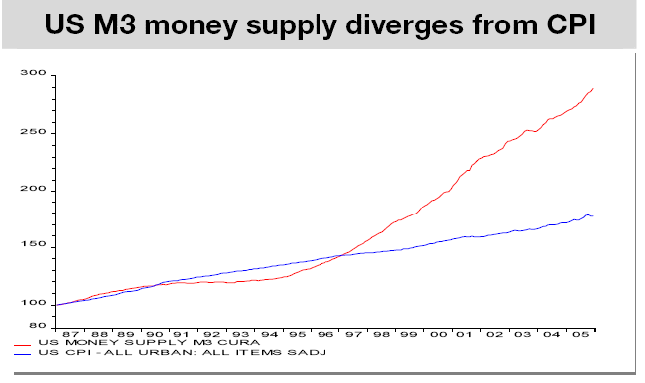 |
|
huck
Contributor

Posts: 81
|
Post by huck on May 14, 2006 16:42:20 GMT -6
It's interesting to note how the M3 supply began diverging from the CPI around 1996. I wonder how this chart would look if the trade inbalance for the year was subtracted from m3 first. If its just being banked in china it isnt acting as an inflationary influence. |
|
|
|
Post by unlawflcombatnt on May 14, 2006 17:00:11 GMT -6
It's interesting to note how the M3 supply began diverging from the CPI around 1996. I wonder how this chart would look if the trade inbalance for the year was subtracted from m3 first. If its just being banked in china it isnt acting as an inflationary influence. That's an interesting question. I'm far from being an expert in this area. If the Chinese "loaned" us enough money, they would increase the total M3 in existence. (I think.) It seems that could increase M3 some. I don't know how that would work out quantitatively. It is reported that last year's trade deficit with China was $200 billion. So if they created that $200 billion exclusively through loans, it seems like it would increase M3 by that amount. Does anyone else have some thoughts on this? |
|
huck
Contributor
Posts: 81
|
Post by huck on May 14, 2006 17:25:02 GMT -6
So if they created that $200 billion exclusively through loans, it seems like it would increase M3 by that amount. Im not sure this is true, first as in "has to increase M3". I think if the loans were used to pay down the debt this would not be true. And then there is what happens when that loan is deposited in the "bank of usa", and based on funny accounting games based on cash reserves how much of that can get loaned out , and re-loaned out, and reloaned out. In this funny accunting, a billion dollar deposit could result in a 6billion increase in M3 i think. Its kinda like how making min payments on your credit cards gets you more credit much faster than your income rises. i bet lc would just love to fill us in on those details. |
|
|
|
Post by lc on May 14, 2006 19:39:16 GMT -6
n
|
|
huck
Contributor
Posts: 81
|
Post by huck on May 14, 2006 23:03:48 GMT -6
but if you are saying that the trade deficit is being used to buy US bonds initiating the cycle of new money supply, again I am not sure that is happening. The Chinese are slowly liquidating their dollar investments, that is public record. Only central banks buy at bond auctions. China at least has been doing this with some of its trade inbalance, and it has been suggested that other central banks as they buy dollars to support it park some of the funds in a like manner. Slowing down is not stopped. My in ital thought had to do with them just papering the trade inbalance by increasing M3. If the a significant amount of the M3 increase was not being spent in the US, but was instead banked/stockpiled outside the US it would not have any inflationary effect HERE. |
|
|
|
Post by lc on May 15, 2006 9:21:33 GMT -6
n
|
|


 )
)