Post by unlawflcombatnt on Apr 21, 2009 15:04:43 GMT -6
I'm posting a link here to all 406 of my photobucket images, in an attempt to preserve history, and counter the attempts to re-write it (with respect to the economy.)
These images are a majority of the images that I've actually uploaded over the last 4 years, and used in my posts (Some of my images are at a different site, which I can no longer find, and which may no longer exist.)
Using these images one can review economic data that was published at an earlier time, and then review how the media and the government have attempted to re-write it by changing previously published numbers.
Many of these older publications are no longer available, such as the National Association of Realtor's (NAR) Existing Home Sales report. Many of the Government's original quarterly reports for GDP and Personal Income are no longer available. Even worse, previous links to those reports have been changed (or eliminated) by the government to obscure their convenient revisions (If anyone can figure out how to upload pdf files, I can upload most of the original GDP reports from 2000-2007--the links to which no longer work--thanks again to the link changes by the Bureau of Economic Analysis--done solely to block access to their earlier and deliberate overstatements--which would expose their deception.)
Interestingly enough, Paul Krugman recently mentioned these downward revisions of earlier numbers in one of his article. He referred to a "bump" that occurred in 2nd quarter GDP in 2002, which he found later had been revised out of existence. (I actually found up-loadable proof of the downward revision, which I will upload soon--before it too becomes unavailable.
Feel free to use any or all of these graphics. Do use caution on images that come from private sources, such as Briefing.com or the National Association of Realtors. The majority of images are from US Government sources which are freely accessible to the public. (the BEA, BLS, Census Bureau, Treasury Dept., etc. In fact, even the CIA has publicly accessible economic statistics.)
Below is the link my Photobucket "collection."
s27.photobucket.com/albums/c190/unlawflcombatnt/?start=0
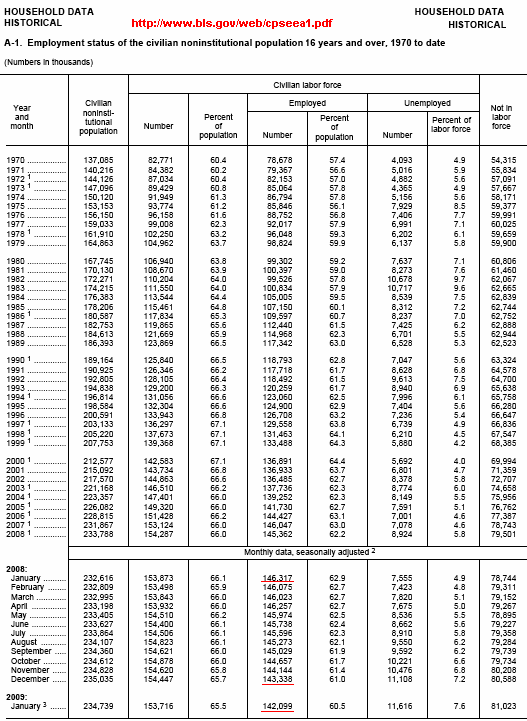
Below is an example of one such image.
(Note: Photobucket loads very slowly.)

The above is the Employment report from the Household Survey. This report changes every month, and there are no links to previous reports. Since this is only a 1-page report, and probably the most informative 1-page that the Government ever publishes, it might be worthwhile to download it each month to your own computer.
These images are a majority of the images that I've actually uploaded over the last 4 years, and used in my posts (Some of my images are at a different site, which I can no longer find, and which may no longer exist.)
Using these images one can review economic data that was published at an earlier time, and then review how the media and the government have attempted to re-write it by changing previously published numbers.
Many of these older publications are no longer available, such as the National Association of Realtor's (NAR) Existing Home Sales report. Many of the Government's original quarterly reports for GDP and Personal Income are no longer available. Even worse, previous links to those reports have been changed (or eliminated) by the government to obscure their convenient revisions (If anyone can figure out how to upload pdf files, I can upload most of the original GDP reports from 2000-2007--the links to which no longer work--thanks again to the link changes by the Bureau of Economic Analysis--done solely to block access to their earlier and deliberate overstatements--which would expose their deception.)
Interestingly enough, Paul Krugman recently mentioned these downward revisions of earlier numbers in one of his article. He referred to a "bump" that occurred in 2nd quarter GDP in 2002, which he found later had been revised out of existence. (I actually found up-loadable proof of the downward revision, which I will upload soon--before it too becomes unavailable.
Feel free to use any or all of these graphics. Do use caution on images that come from private sources, such as Briefing.com or the National Association of Realtors. The majority of images are from US Government sources which are freely accessible to the public. (the BEA, BLS, Census Bureau, Treasury Dept., etc. In fact, even the CIA has publicly accessible economic statistics.)
Below is the link my Photobucket "collection."
s27.photobucket.com/albums/c190/unlawflcombatnt/?start=0
Below is an example of one such image.
(Note: Photobucket loads very slowly.)

The above is the Employment report from the Household Survey. This report changes every month, and there are no links to previous reports. Since this is only a 1-page report, and probably the most informative 1-page that the Government ever publishes, it might be worthwhile to download it each month to your own computer.
