|
|
Post by jeffolie on Jun 29, 2012 15:31:24 GMT -6
Stocks high & wide since 1999 ... similar to other sideways high & wide periods Bonds 30 year bear market ... similar to other Bonds 30 year bear market Does economic history repeat? Yes, it rhymes but not exactly The FUTURE ... Make you own guesses, I have posted mine often enough ==================== Equity prices & bond yields since 1900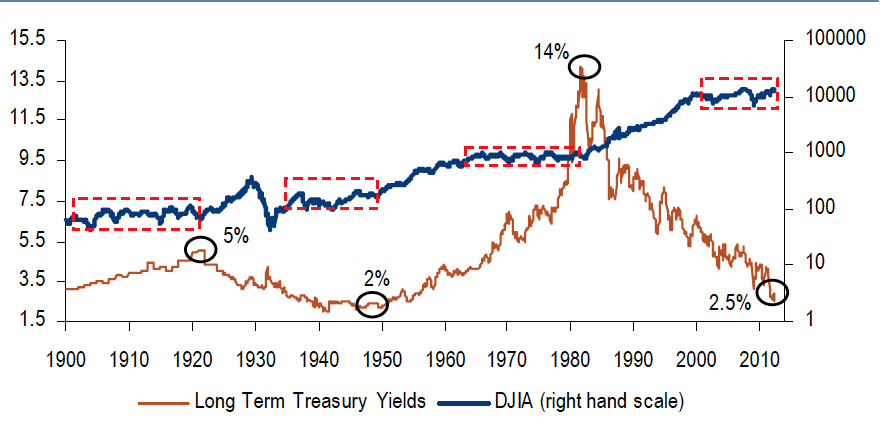 Picture Guide to Financial Markets Since 1800 June 29th, 2012 I don’t often give props to big Sell Side firms, but today I must make an exception. Merrill Lynch’s Equity Strategy group put out The Longest Pictures: Picture Guide to Financial Markets Since 1800 this week. Its a 102 page doozy looking at every asset class and country going back through the history of time. It illustrates a variety of long-run trends in financial markets. The chart above shows equities in their 4th secular trading range — aka Bear market — while bonds are enjoying their 2nd great secular bull market of the past 110 years. I am in concurrence with this perspective: “We nonetheless remain of the view that the catalyst for a decisive change in secular market leadership (or “Great Rotation”) awaits a “good” bear market in bonds caused by real estate, labor and banking markets ending the current Era of Deleveraging.” In other words, until this secular bear market ends — perhaps with the Bond market cracking — expect contained equity markets and modest returns. I cannot give out their copyrighted work, but you should definitely get your hand on this if you can (surely you know someone who works at BofA/Merrill?). Nicely done. Source: The Longest Pictures Michael Hartnett, Chief Global Equity Strategist BofA Merrill Lynch 27 June 2012 |
|
|
|
Post by jeffolie on Jul 29, 2012 17:38:17 GMT -6
Where we are now............ Below...comparing prior SECULAR BEAR MARKETS...this current one may have 50% more to go... in time to be fair, not downside prices I disagree that the below its to be taken at face value because each SECULAR BEAR MARKET is driven somewhat differently... I adhere to the saying attributed to Mark Twain that "History never repeats, but sometimes it rhymes". My jeffolie view remains that 1st the EU implodes(reorganizes with some leaving and the Northern EU consolidating) impacting the euro, then the Dollar implodes (significantly declines) plus the stock market declines at least one more time as gold rises to a level equal to the sinking DJIA forming a bottom. ================================ How Much More Does The Bear Market Have To Go? 07/29/2012 The secular bear market that the US has been caught in for a better part of the last decade will end. Eventually. The only question is when. Last week we reported that the bulk of market gains year to date, has been driven exclusively by PE multiple expansion, which is to be expected: EPS forecasts for the end of 2012 are now the lowest they have been since the beginning of the year. Yet while such sharp, sudden and short and bear-market rallies, exclusively on the back of the global central banks, are to be expected, the bigger question is how much more of a secular decline in PE multiples is to be expected before the bear market ends and a new bull market can begin. As the following chart from Crestmont Research shows there is quite a bit more to go, even with Fed assistance (or rather, because of it, and its forced rejection of reaching a fair clearing price sooner rather than later), before the bear market is officially over. Just over 50% more. To the downside.How the Bear Market declines have looked in perspective, and where we ultimately have to go before all the artifical supports are cleared out:  And the Bull Markets preceding them...  h/t Things That Make you go Hmmm www.zerohedge.com/news/how-much-more-does-bear-market-have-go
|
|
|
|
Post by jeffolie on Jul 30, 2012 10:00:01 GMT -6
Today's SECULAR BEAR MARKET will be followed by a huge gain in stocks someday. The problem of timing is difficult. Japan's stock market remains in a SECULAR BEAR MARKET for going on 23 years. Will ours be a SECULAR BEAR MARKET lasting over 20 years...there was a US 30 year SECULAR BEAR MARKET in the late 1800s.
SECULAR BEAR MARKETS can be recognized as long trading ranges for stocks that are followed by bull markets that last years and are good times to be in stocks. Today, the stock market is in a SECULAR BEAR MARKET. It is hard to 'see the forest for the trees' when in a SECULAR BEAR MARKET because the phrase BEAR MARKET is different from the term SECULAR BEAR MARKET. Merely a bear market means a loss of 20% and a merely a bull market means a gain of 20%, while the beakout of a SECULAR BEAR MARKET can be huge such as the 800 to 14000 last run from the 1982 bottom.
The point of the chart is to consider when to enter stocks and when to exit bonds based on long term trend changes. the difficulty is that low interest rates can stay low for extended periods of time such as Japan's 23 years and continuing low interest rates.
Here are some approaches to picking long term bottoms when bond rates already are low:
1. Wait until the market p/e's are 8 and/or below
2. Wait until the price of gold equals the price of the DJIA
3. Wait until there is 'blood in the streets'
Yes, sometimes bonds beat stocks; and, then no, sometimes stocks beat bonds.
From a low of about 800 to a high of about 14000 for the DJIA seems like a hard act to beat. Even from the a start of 1000 if one missed the 800 DJIA low to today's DJIA of 13000 seems like a hard act to beat. Plus one must add into the stock returns the dividends paid by the DJIA for total return on stocks. Then one should consider taxes because dividends do get taxes at a different rate than the bonds interest paid, right? And consider that the tax rate depends on one's tax brackets or tax sheltered retirement accounts.
==============
As to the DJIA turnover and changing the corporations included in the list...yes there is change, just as a mutual fund has changes. One would have to match the index which can easily be done with various investment vehicles although these vehicles take a bite for fees of different types.
|
|
|
|
Post by jeffolie on Jul 30, 2012 16:46:56 GMT -6
Here is yet another look at long term secular market. Its become one of our favorite charts because of how much it reveals about the cyclical nature of things . .http://www.ritholtz.com/blog/2012/07/dow-jones-industrial-average-since-1900/ 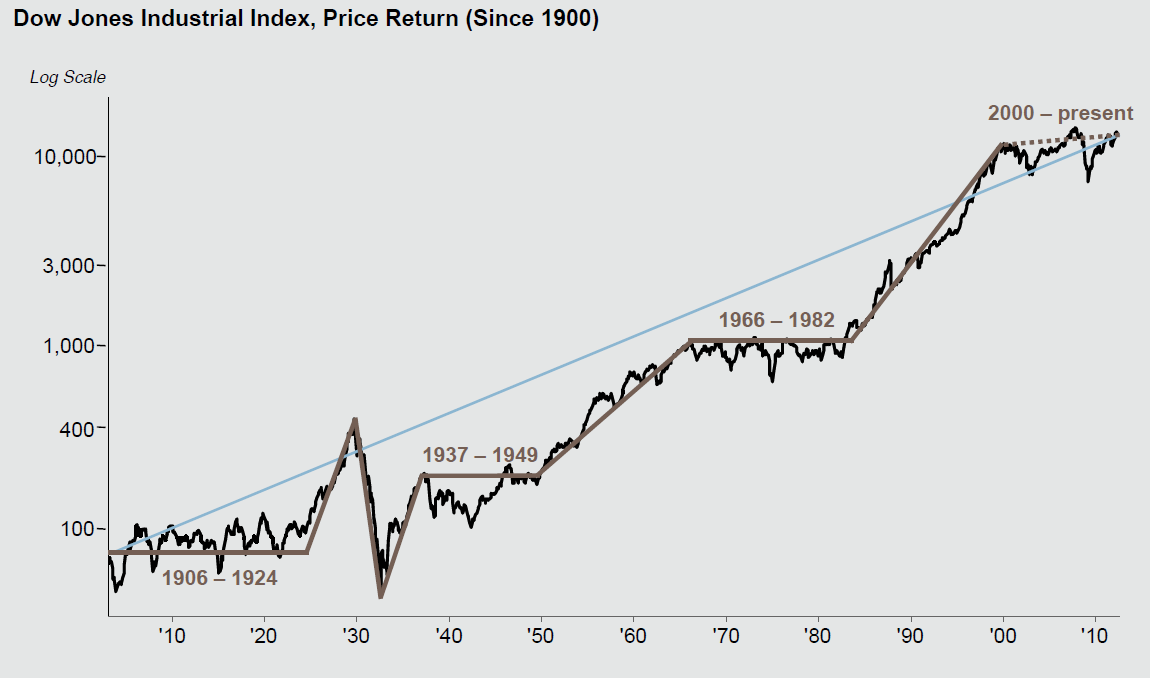 |
|
|
|
Post by unlawflcombatnt on Jul 30, 2012 22:10:55 GMT -6
Does this take inflation into account?
There's been at least a 30% CPI increase since 2000. Does this take into account a corresponding 30% decrease in the value of equal $-amount of returns or stock value.
It certainly does not appear like it to me.
An 8-9% increase in the current-dollar value of stocks and/or returns
equates to a -21 to -22% decrease in "real" stock prices.
|
|
|
|
Post by jeffolie on Jul 31, 2012 11:50:14 GMT -6
Does this take inflation into account? There's been at least a 30% CPI increase since 2000. Does this take into account a corresponding 30% decrease in the value of equal $-amount of returns or stock value. It certainly does not appear like it to me. An 8-9% increase in the current-dollar value of stocks and/or returns equates to a -21 to -22% decrease in "real" stock prices. I did not create these charts and do not have access to their methods and adjustments. I agree...inflation appears to be omitted as well as many possible factors ... this appears to be a 'nominal' index without adjustments |
|
|
|
Post by jeffolie on Jul 31, 2012 12:18:57 GMT -6
....most American fail to understand long term inflation...this is a great set of charts from bart The SECULAR BEAR MARKET definition has been published based on nominal indexes without adjustments for anything. Most Americans think of a BEAR market and few think of a SECULAR bear market. Bear markets are so common that the adjustments for dividends and inflation have little impact because they 'can not see the forest for the trees' and constantly look at the last major market move in 1 to no more than 5 year terms. Barts charts are so dramatic in part because the impact of decling purchasing power or CPI compounds over long periods where most Americans rarely notice much compounding beyond year over year number that they mostly ignore. bart did the following work and adjustments: "... if you only use CPI to attempt to do a real apples to apples comparison, the main US stock markets are quite far off their year 2000 highs... aka, in a bear market. Dow with dividends (based on starting values matching in 2000) on 1/7/2000 was 51439. CPI adjusted value as of 6/29/2012 was 44996. CPPI adjusted was 26898. 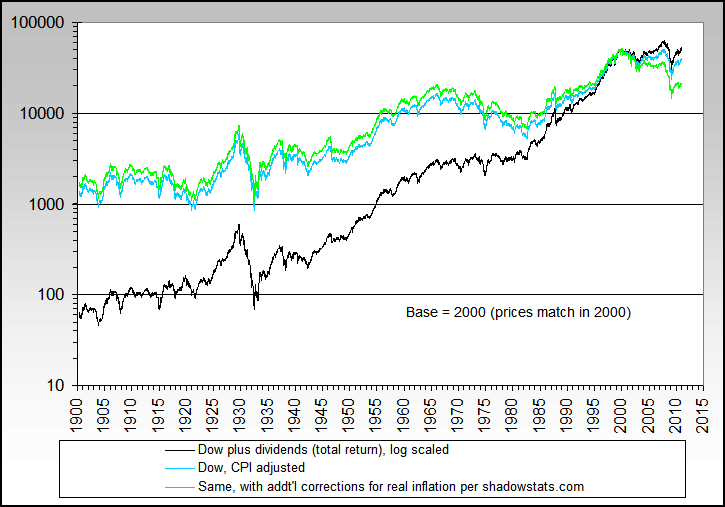 Dow excluding dividends 1/1/2000 value was 11522. CPI adjusted value as of 6/29/2012 was 9446, CPPI adjusted was 5647. 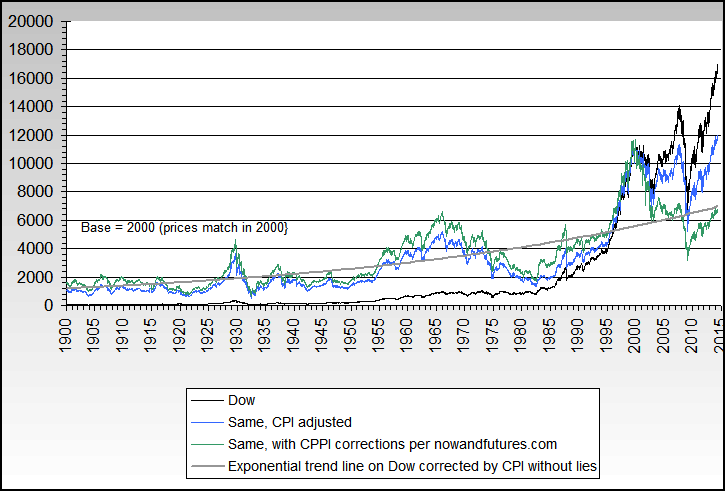 [/quote] |
|
|
|
Post by jeffolie on Jul 31, 2012 12:45:52 GMT -6
Taxation
When a chart considers dividends, then I notice it rarely includes the taxation of those dividends which reduces the value of the dividends. Also, indexes change the stocks in the indexes which requires the buying and selling of the changed stocks to adjust and maintain the same list of stocks in the index...this is a taxable event and reduces the principle or amount to reinvest or requires additional funds to be added to adjust to the new stocks in the index. Tax rates involve different marginal rates which have changed over time as well as the distinction for holding periods to qualify as long term or short term tax treatment. These are just a few taxation issues there are many more but they become complex such as tax sheltered income vehicles, pensions, annuities, trusts, etc.
Ignoring taxation further reduces the value of these definitions over the long term.
Brokerage fees or transaction costs also get ignored...and further reduces the value of these definitions over the long term.
|
|
|
|
Post by jeffolie on May 29, 2013 16:53:27 GMT -6
|
|


