|
|
Post by unlawflcombatnt on Aug 30, 2012 11:53:18 GMT -6
|
|
|
|
Post by jeffolie on Aug 30, 2012 15:36:13 GMT -6
Bart and John Williams have their own measures of inflation. Bart now labels it CPPI as a measure of the 'Consumer Purchasing Power Index'. Doug Short accepts the govt versions of CPI and PCE as inflation standards. My own view centers on the most common American's expenses which I call screwflation. "... CPI-U and CPPI trends diverging, CPI about 1.8% and CPPI about 4.8% ... CPI-U down trending, CPPI uptrending. ... " I did post and create a few thread predicting that the 3rd quarter would eventually be marked as the beginning of a new recession according to the govt approved agency for these matters which you alluded to above...(NBER wise) who are not so wise and always revises data for years as manipulated by changing the components of the underlying formulas to determine the finalized data[ I recall posting a piece on how they FED inflation components were weighted differently for each subcomponent at the St. Louis FED for my son who just got his degree in Economics in May]. M3 is showing signs of a trend reversal. 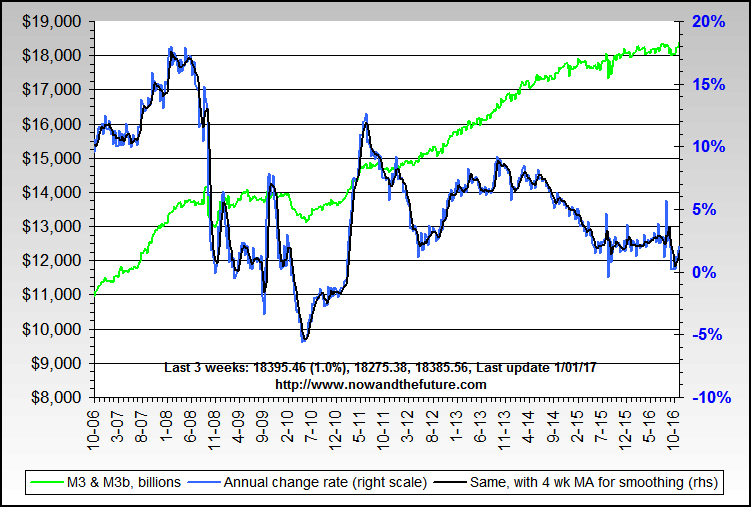 Velocity probable bottom, CPI & CPPI diverging trends www.itulip.com/forums/showthread.php/23126-Velocity-probable-bottom-CPI-CPPI-diverging-trendsJune decline in Retail Sales Growth ?  Velocity is the turnover of money, how often people spend money including businesses .... Bart's preferred Velocity [the black line] is flat 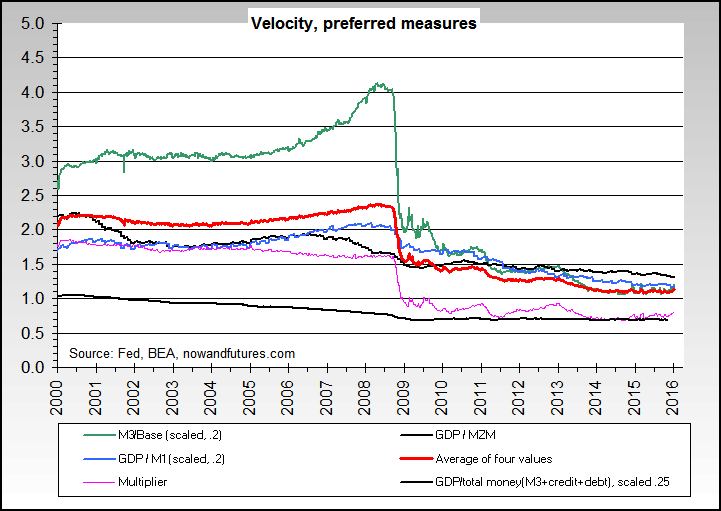 CPI-U and CPPI trends diverging, CPI about 1.8% and CPPI about 4.8% CPI-U down trending, CPPI uptrending. 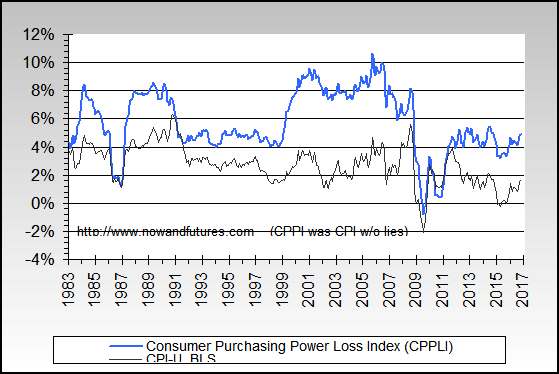 Bart posted: " ...Yes, inflation is likely coming back. Velocity, having been so depressed, is probably the main driver. The Fed's money multiplier (pink in the first chart) has been up over 10% year over year since early April. Bart posted: " ...Health insurance is up about 14% year over year, even per the BLS. Rents are going up at a minimum of 5%/year. my jeffolie comment: Is the Housing Jump just a meaningless summer, seasonal blimp or is it the beginning of increased Demand with constricted, limit release of shadow inventory houses? Looking at 2010, 2011 ... I vote for meaningless summer jump ... you decide for yourself Bart posted: " ...Quite a whopper change in housing prices, per the weekly Dataquick dataset.  www.nowandfutures.com/images/dataquick_real_estate_weekly.png www.nowandfutures.com/images/dataquick_real_estate_weekly.png |
|
|
|
Post by unlawflcombatnt on Aug 30, 2012 23:50:52 GMT -6
The core Retail Sales number is the most significant of the charts in my opinion.
___________________
But going back to the BEA's Personal Consumption Expenditure inflation, this is a knowingly manipulated number.
Employing the substitution effect, the goods that did NOT rise in price are given a higher weighting than the ones that did--if consumers bought more of the lower-priced items.
For example, if all consumers started buying hamburger instead of steak--because the price of steak increased but not hamburger--then this would show little inflation. This is because consumers stopped buying the inflated-price item, while substituting the non-inflating price item.
Obviously this would understate true inflation, since consumers simply bought less of the price-inflated item due to its price.
This is wrong on its face.
Simply substituting a cheaper, lower quality item for a higher-priced, higher quality item results in a reduced inflation calculation--as far a Government bean-counters are concerned.
If I buy a cheap wooden baseball bat for monetary reasons, instead of a more expensive aluminum bat, it shouldn't result in a reduction in calculated inflation.
But as a result of the "substitution effect", may inability to afford the more expensive aluminum bat results in a reduction in the inflation calculation, because less of the more expensive aluminum bats are sold. This decreases their proportional contribution to the inflation calculation.
|
|
|
|
Post by jeffolie on Aug 31, 2012 11:40:40 GMT -6
The core Retail Sales number is the most significant of the charts in my opinion. ___________________ But going back to the BEA's Personal Consumption Expenditure inflation, this is a knowingly manipulated number. Employing the substitution effect, the goods that did NOT rise in price are given a higher weighting than the ones that did--if consumers bought more of the lower-priced items. For example, if all consumers started buying hamburger instead of steak--because the price of steak increased but not hamburger--then this would show little inflation. This is because consumers stopped buying the inflated-price item, while substituting the non-inflating price item. Obviously this would understate true inflation, since consumers simply bought less of the price-inflated item due to its price. This is wrong on its face. Simply substituting a cheaper, lower quality item for a higher-priced, higher quality item results in a reduced inflation calculation--as far a Government bean-counters are concerned. If I buy a cheap wooden baseball bat for monetary reasons, instead of a more expensive aluminum bat, it shouldn't result in a reduction in calculated inflation. But as a result of the "substitution effect", may inability to afford the more expensive aluminum bat results in a reduction in the inflation calculation, because less of the more expensive aluminum bats are sold. This decreases their proportional contribution to the inflation calculation. The problem I have is a class issue or consume Type 1 and type 2. Retail Sales of new cars mostly reflects the lifestyles of the upper 20% of incomes/wealth which I call for convenience Type 1 as opposed to the rest as Type 2. New Houses[furniture, appliances, paint, etc] and New cars generate directly and indirectly a significant portion of Retail Sales. Tracting Retail Sales can in part reflect gains in the Stock Market for Type 1 consumers rather than jobs. I prefer to call inflation the additional expenses of living including higher taxes, fees, tariffic tickets, property tax, rent, food, gas for the most common American as screwflation...for the 80% of incomes/wealth below the upper 20%. Retail sales for type 2 relate to clothes in going back to school not fashion, designer cloths for Type 1 consumer. |
|
|
|
Post by jeffolie on Sept 1, 2012 9:49:28 GMT -6
July World food +10% Food is a middle to lower class issue...a Type 2 Consumer issue Type 1 Consumers of the upper 20% of incomes/wealth spend a very small percentage of their income/wealth on buying stables such as food. Food prices are included in my jeffolie 2012 screwflation prediction along with stables such as electricity rates, gasoline, tuition, healthcare insurance premiums...aim to address the most common American. ========================= World food prices jumped 10 percent in July - World Bank World food prices jumped 10 percent in July as drought parched crop lands in the United States and Eastern Europe, the World Bank said in a statement urging governments to shore up programs that protect their most vulnerable populations. From June to July, corn and wheat prices rose by 25 percent each, soybean prices by 17 percent, and only rice prices went down, by 4 percent, the World Bank said on Thursday. Overall, the World Bank's Food Price Index, which tracks the price of internationally traded food commodities, was 6 percent higher than in July of last year, and 1 percent over the previous peak of February 2011. U.S. soybean futures hit a record high of $17.78 per bushel in trading on Thursday, while corn futures remained near the record of $8.49 set earlier this month. in.reuters.com/article/2012/08/30/worldbank-food-prices-idINL2E8JU7WS20120830 |
|

