|
|
Post by jeffolie on Nov 10, 2012 13:09:26 GMT -6
Rich won: wealth gains, the rest lost Type 1 consumers invest their wealth in stocks, bonds, flipping houses while the rest, type 2 consumers suffer negative wealth from the housing bust. 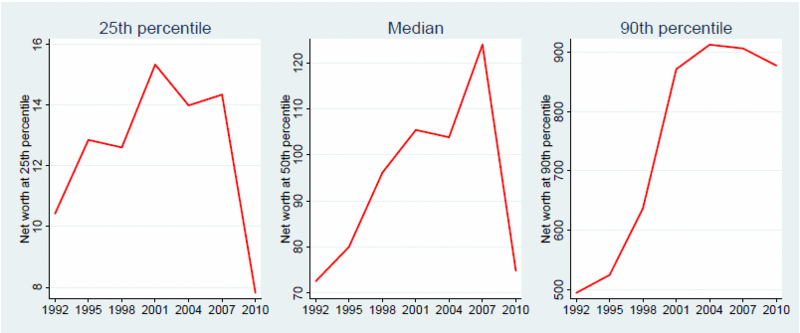 4.bp.blogspot.com/-_1cFgl1Bp0U/UJ1y1oUyKcI/AAAAAAAAfv0/m2u9gasKYsI/s1600/networth+decline+by+percentile.png 4.bp.blogspot.com/-_1cFgl1Bp0U/UJ1y1oUyKcI/AAAAAAAAfv0/m2u9gasKYsI/s1600/networth+decline+by+percentile.png09 November 2012 The Distribution of Economic Pain From the Financial Crisis in One Chart No wonder the wealthiest ten percent feel so clever, and even perhaps triumphant. The collapse caused by the widespread banking fraud has barely affected them, whereas it wiped out most of the last ten years of growth in the middle class and the poor. In my considered opinion this is largely the result of policy and tax decisions that have been made by the government over the past twenty or more years, in which they fostered a financially predatory economy. Financial bubbles are often wealth transfer mechanisms, and in this case it appears that you can also keep what you kill. From Amir Sufi, Professor of Finance at the University of Chicago. Net Wealth Shock in US, by Net Worth Percentile www.jessescrossroadscafe.blogspot.com/2012/11/the-distribution-of-economic-pain-in.html |
|
|
|
Post by jeffolie on Nov 10, 2012 13:41:11 GMT -6
Foodstamps Surge post election release Govt manipulates economic numbers ... no surprise " ... USDA delayed its release nine days past the semi-official deadline, far past the election, and until Friday night to report August foodstamp data. One glance at the number reveals why: at 47.1 million, this was not only a new all time record, but the monthly increase of 420,947 from July was the biggest monthly increase in one year. One can see why a reported surge in foodstamps ahead of the elections is something the USDA, and the administration may not have been too keen on disclosing.my jeffolie view: for years my Jan 1st predictions included ever increasing Food Stamp RECORDS. Why? Because America's "Bread and Circuses" to avoid food riots works politically even as America slowly dies culturally and financially sinced 1999 as real median wages decline and 'screwflation' dominates while the Rich Won. ============================= Foodstamps Surge By Most In One Year To New All Time Record, In Delayed Release 11/10/2012 While there had been speculation that the BLS may delay the release of its October nonfarm payroll number until after the election, it turned out there was no reason to worry. Perhaps this is because the number, while at stall speed, was not quite as horrible as some had expected (even if the change in average hourly earnings did tumble to new all time lows) and so boosted Obama's reelection chances. There was, however, another closely tracked number which perhaps is far more indicative of the economic "growth" in the past 4 years, which certainly had a delayed release. The number of course is that showing how many Americans are on foodstamps, and usually is released at the end of the month, or the first day or two of the next month. This time the USDA delayed its release nine days past the semi-official deadline, far past the election, and until Friday night to report August foodstamp data. One glance at the number reveals why: at 47.1 million, this was not only a new all time record, but the monthly increase of 420,947 from July was the biggest monthly increase in one year. One can see why a reported surge in foodstamps ahead of the elections is something the USDA, and the administration may not have been too keen on disclosing. www.zerohedge.com/sites/default/files/images/user5/imageroot/2012/10-2/August%20Foodstamps.jpg www.zerohedge.com/sites/default/files/images/user5/imageroot/2012/10-2/August%20Foodstamps.jpgFoodstamps at the household level also rose to a record 22.685 million:  www.zerohedge.com/sites/default/files/images/user5/imageroot/2012/10-2/Foodstamps%20Households.jpg www.zerohedge.com/sites/default/files/images/user5/imageroot/2012/10-2/Foodstamps%20Households.jpgFinally, going back to the start of the official start of the depression in December 2007. In the 57 months from then until August 2012, there have been 4.6 million jobs lost even as Americans on foodstamps and disability have risen by 21.2 million.  www.zerohedge.com/sites/default/files/images/user5/imageroot/2012/10-2/Jobs%20vs%20Foodstamps%20and%20Disability%20August.jpg www.zerohedge.com/sites/default/files/images/user5/imageroot/2012/10-2/Jobs%20vs%20Foodstamps%20and%20Disability%20August.jpgAnd the same shown on a monthly basis:  www.zerohedge.com/sites/default/files/images/user5/imageroot/2012/10-2/Jobs%20vs%20Foodstamps%20and%20Disability%20August%20Monthly.jpg www.zerohedge.com/sites/default/files/images/user5/imageroot/2012/10-2/Jobs%20vs%20Foodstamps%20and%20Disability%20August%20Monthly.jpgDelay explained. Source: USDA and SSA www.zerohedge.com/news/2012-11-10/foodstamps-surge-most-one-year-new-all-time-record-delayed-release |
|
|
|
Post by jeffolie on Nov 10, 2012 14:39:04 GMT -6
Asset Poverty Is Rising One in five American households is asset poor, according to the Urban Institute. Asset poverty is defined as not having enough net worth (wealth) to survive for three months at the federal poverty level--or $5,580 in net worth for a family of four. The percentage of households in asset poverty grew from 16.1 to 19.6 percent between 2007 and 2010. The asset poverty rate is highest among the youngest householders... Asset poverty rate by age of householder, 2010 Under age 30: 43.2% Aged 30 to 49: 29.3% Aged 40 to 49: 19.9% Aged 50 to 61: 13.4% Aged 62 to 69: 8.7% Aged 70-plus: 7.9% Source: Urban Institute, U.S. Asset Poverty and the Great Recession www.urban.org/publications/412692.htmldemomemo.blogspot.com/ |
|
|
|
Post by jeffolie on Nov 10, 2012 14:47:45 GMT -6
about $57,000 for individuals ... they buy new cars "... 80.62056% ... $57,427.84 " ... 66.6 percent of wage earners had net compensation less than or equal to the $41,211.36 " ... [ 50% ] (half earned less) was $26,965 my jeffolie view: the Type 1 consumer has the upper 20% of incomes/wealth ... that bar for income appears to be merely about $57,000 for individuals ... they buy new cars ==================================== Wages in 2011 American workers earned $6 trillion in 2011, according to W-2 data reported by employers to the Social Security Administration. The median wage (meaning half of workers earned more and half earned less) was $26,965. Of the nation's 151 million workers, 102,694 earned $1 million or more. At the very top of the scale, 93 workers earned $50 million or more in 2011. Source: Social Security Administration, Wage Statistics for 2011 www.ssa.gov/cgi-bin/netcomp.cgi?year=2011demomemo.blogspot.com/================================ " ... The "raw" average wage, computed as net compensation divided by the number of wage earners, is $6,238,607,249,941.26 divided by 151,380,749, or $41,211.36. Based on data in the table below, about 66.6 percent of wage earners had net compensation less than or equal to the $41,211.36 raw average wage. By definition, 50 percent of wage earners had net compensation less than or equal to the median wage, which is estimated to be $26,965.43 for 2011. 55,000.00 — 59,999.99 4,460,061 122,044,013 80.62056 256,131,662,435.93 57,427.84 Source: Social Security Administration, Wage Statistics for 2011 www.ssa.gov/cgi-bin/netcomp.cgi?year=2011
|
|
|
|
Post by unlawflcombatnt on Nov 11, 2012 1:04:29 GMT -6
about $57,000 for individuals ... they buy new cars "... 80.62056% ... $57,427.84 " ... 66.6 percent of wage earners had net compensation less than or equal to the $41,211.36 " ... [ 50% ] (half earned less) was $26,965 At $26,965 year, that means the median worker, assuming a historically recommended max of 25% of income going to shelter (rent or mortgage)-- should be paying no more than $561/month in rent or mortgage. Of course most are paying far more than that, which is another reason our economy is tanking. Wages that should be going toward creating production demand (and jobs) are going to pay for overpriced homes and excessively high rent. By the way, Jeff, this is a great thread. |
|
|
|
Post by spudbuddy on Nov 12, 2012 17:49:49 GMT -6
A national slurpy sucking carnival for a relatively select few. (and for the rest, imitation is the sincerest form of battery) not flattery. Great thread, indeed.
That blue Mount Everest of food stamps sure is invigorating - just like the actual climb itself.
It was a long hard climb....however many angels can dance on the head of a pin - 15% of the population have a hard time balancing on top of that mountain.
A $561 rent? I remember that - in the 1980's. I'd say for many, the percentage of income going for housing has climbed 15 or 20 points since then.
Curious thing: It takes someone able to buy a new car to create a good used car (the kind the rest of us drive.) Still seems to be happening at remarkable levels (driven - on credit.)
|
|
|
|
Post by unlawflcombatnt on Nov 12, 2012 23:18:39 GMT -6
A $561 rent? I remember that - in the 1980's. I'd say for many, the percentage of income going for housing has climbed 15 or 20 points since then. Yes, that's about what my recollection is as well. In 1994, rent on my 2-bedroom apt in Anaheim (Orange County) California was $600/month. In 2010, rent on a less desirable 2-bedroom apt in Cypress (Orange County) California was $1,250/month. Meanwhile, my income was approximately the same in 2010 as it had been in 1994. And I had to pay for my own health insurance in 2010, whereas it had been included in my pay in 1994. Interesting point, Spudbuddy. I'd never thought about that. |
|


