|
|
Post by jeffolie on Mar 10, 2013 15:35:25 GMT -6
Velocity, Slow Money & inflation, next 2 years Why has inflation as published by the lying govt and repeated across the world remained so tame, low in America?The below piece states an often published fear of upcoming high inflation which well published John Williams of Shadowstats has warned often will become hyperinflation by the end of 2014 revised from his prior warning that hyperinflation would start THIS YEAR. Below, Bruce Krasting warns that when velocity ... money turnover ... jumps, then inflation will explode. my jeffolie view: low or no inflation during 2013 & 2014 in America... inflation will come from a Dollar crisis after the EU crisis first and most likely the EU crisis will start late in 2013 or in 2014 because Germany has elections in Sept 2013. =================================== Slow Money - Big Money by Bruce Krasting on 03/08/2013 Supply Money Velocity Recession With the DOW blowing by milestones I went looking for other things that were at record levels. The first one that I looked at was M2. No surprise at all, M2 is bigger than ever. Charts of the long and short term trajectory of money supply:  brucekrasting.com/wp-content/uploads/2013/03/Screen-Shot-2013-03-08-at-12.57.43-PM.png brucekrasting.com/wp-content/uploads/2013/03/Screen-Shot-2013-03-08-at-12.57.43-PM.png The money supply is $3T higher than it was at the start of the 2008 recession. GDP is up $2T.  brucekrasting.com/wp-content/uploads/2013/03/Screen-Shot-2013-03-08-at-12.58.59-PM.png brucekrasting.com/wp-content/uploads/2013/03/Screen-Shot-2013-03-08-at-12.58.59-PM.png There is another component of M2. It has me baffled. It too is at a record. In this case it's a record low. I'm sure this important. I don't know why it's happening. I don't know what the consequences of this will be. This chart is screaming something:  brucekrasting.com/wp-content/uploads/2013/03/Screen-Shot-2013-03-08-at-1.01.33-PM.png brucekrasting.com/wp-content/uploads/2013/03/Screen-Shot-2013-03-08-at-1.01.33-PM.png My thoughts on the chart: - It's fairly clear that sharp declines in the velocity of money is consistent with periods of recession. But.. - If recessions are the cause of the decline in velocity, what the heck is going on today? We are now three years out of recessions, and velocity keeps dropping. - Behind each of the recessions is the Federal Reserve. To offset a slowdown in the economy, it drops interest rates. When interest rates fall, velocity declines. - As interest rates have been forced to zero for years past the last recession, the velocity of money has continued to decline. - There are no periods in history where sustained economic expansion has occurred while money velocity is declining. If you buy into my (admittedly un-scholarly) assessment of money velocity, then you might conclude: * The Fed's ZIRP policy has outlived its usefulness as a policy tool. * The Fed's policy on Forward Guidance for short-term interest rates (another two years of ZIRP) is accelerating the decline in money velocity, and therefore counter productive. Clearly, Bernanke and the other Fed Doves don't think there is a connection between record low money velocity and ZIRP. In fact, they must believe precisely the opposite. These folks are aware of the collapse in velocity, they know that this drop is a drag on the economy (particularly inflation), yet they have committed themselves to a policy that (IMHO) insures that money velocity stays historically low. Go figure. One final thought on money velocity - it will return to a more normal level at some point. This may not happen until years into the future when monetary policy goes off "Fast Forward". But it will happen. When it does, the high octane gas that is now M2 and not moving; will become the bloated M2 that is moving. Another dumb question comes to mind.: The Fed has said that it will not back off until inflation gets to 3%. But when the Fed does back off, money velocity should accelerate very quickly - and this should give inflation another big boost. So when the Fed finally does respond to rising inflation, its actions will light a fuse on more inflation. The Fed Doves are not thinking of that scenario. If they did, they would be not so confident in their ability to control the outcome. That, or they're bluffing www.zerohedge.com/contributed/2013-03-08/slow-money-big-money |
|
|
|
Post by jeffolie on Mar 11, 2013 6:32:04 GMT -6
bart posted: " The problem with just using M2 velocity is that it ignores all the other (and equally valid) ways of measuring velocity.
Even more condemnatory of M2 velocity, it shows a big drop at the same time that nominal retail sales, auto sales, etc. are growing - and at the same time that household total income is dropping (or not growing at the same pace as the various sales numbers), and that the savings rate is also dropping.
They all just plain can't be true, and my vote is that M2 velocity is incorrect and misleading. My work shows that velocity is level at worst and slightly growing when viewing it conservatively.========================== from bart's Blog blog.nowandfutures.com/index.html : Velocity is level to slightly up (red line). www.nowandfutures.com/images/velocity_preferred_short.png " .... Deleveraging... 3/9/2013 Deleveraging is dead. Looking forward: Currency +7.7%, M1 +10.1%, M2 +6.9%, M3b +6.4%, Z1 total credit +3.1%, total mortgage debt +3.1%, total Federal debt +7.5% (public sector +7.2%), total state & local debt +.2%, Fed's System Open Market account (86% of their balance sheet) +9.4%. All are annual change rates. Velocity is level to slightly up (red line). www.nowandfutures.com/images/velocity_preferred_short.png Conference Board Consumer Confidence Inflation Rate Expectation 12-Month Hence +5.5% (CONCINFL:IND), ECRI future inflation gauge 5.1%. Both ISM prices paid are around 61.6. Real GDP per the BEA hovering just above zero growth. Consumer Purchasing Power Loss Index Stagflation (will be)(is) alive and well. blog.nowandfutures.com/index.html |
|
|
|
Post by jeffolie on Mar 21, 2013 6:14:45 GMT -6
Why Global Economies Face an Age of Deflation By A. Gary Shilling Mar 20, 2013 In recent years, monetary and fiscal stimulus across the world have led to the assumption that serious inflation, if not hyperinflation, is on its way. I believe chronic deflation is more likely. The expectation of rising prices is reasonable. Most people have only experienced inflation. The last meaningful episode of deflation was in the 1930s. That’s also the last time the U.S. was truly at peace. Deflation is a peacetime phenomenon. The U.S.’s bouts of inflation, however, have historically occurred during wartime. That applies not only to shooting wars, but to the Cold War and the War on Poverty. These are periods when vast overspending by the federal government is combined with a robust private economy. These aren’t the conditions we have today, when government stimulus can’t offset private-sector weakness. In the 95 wartime years since 1749, wholesale price increases averaged 5.7 percent. In the 168 peacetime years, they fell 1.2 percent annually on average. As the U.S. withdraws from Iraq and Afghanistan and as defense spending declines, peacetime conditions are likely to prevail. Furthermore, we tend to have biases that cloud our perception of inflation. When we pay higher prices, we think inflation is at work, but we believe lower prices are a result of our smart shopping and bargaining skills. Consumer Prices Even though deflation has been forestalled in the past decade, disinflation -- declining rates of inflation -- has prevailed since the early 1980s. Indeed, the consumer-price index fell in November and December and was unchanged in January. For February, the cost of living in the U.S. was up 0.7 percent, the first increase in four months and the biggest since June 2009. Nonetheless, expectations for inflation over the next 10 years are for a continued drop. Deleveraging: In a normal economy, chronic deflation would already be well established. Our global economy, however, is dominated by deleveraging in the private sector and financial institutions, and is highly deflationary. These actions are overpowering the effects of stimulus programs since 2007. Even with all the government measures, the U.K. is in a recession, as is the euro area. China’s gross-domestic-product growth has slowed considerably and the U.S. reported a mere 0.1 percent annual increase in real GDP for the fourth quarter of 2012. The liquidity created by central banks is tiny compared with the destruction wrought by deleveraging financial sectors. The decline in securitizations is just one aspect of this contraction. Banks are eliminating or writing down off- balance-sheet vehicles substantially. Governments are increasing capital requirements even as banks dump assets to raise capital ratios. Increased Saving: The U.S. household-savings rate fell to 1 percent in 2005 from 12 percent in the early 1980s. This decline of about one-half a percentage point per year meant that consumer spending rose on average around a half percentage point faster than GDP, adding about the same growth to total economic activity once multiplier effects are included. U.S. imports drove growth in Asian and other export-led economies. Americans are now being forced to save more. First, as a result of the volatility in stocks since 2000, and especially since 2008 because they no longer trust their equity portfolios to substitute for savings when it comes to financing their kids’ college educations and their own early retirement. Home equity that once was used to finance spending is no longer available, a casualty of withdrawals and falling house prices. Job insecurity encourages saving for contingencies. Savings Rate In the years ahead, I expect the half-percentage-point annual drop in the savings rate to be replaced by a one- percentage-point annual gain. This would slice 1.5 percentage points off consumer-spending gains as well as GDP growth, after multiplier effects are accounted for. That alone would drop aggregate growth to 2.2 percent from the 3.7 percent annual increases in the period from 1982 to 2000. Other Deflationary Forces: Fertility rates are below the replacement level of 2.1 in most industrialized countries, and populations around the world are aging. As a result, the ratio of working-age people to total population will shrink, retarding economic growth. Substandard education systems, especially in the U.S., restrain productivity growth, employment gains and economic advances. Instead of investments in education, research and productivity-enhancing capital equipment, the emphasis has been on consumer spending, housing and financial assets, which do little to enhance productivity and can curtail growth. Deflation also is a result of the huge gap between U.S. annual real GDP and its potential long-term trend growth. Excess supply is the root cause of deflation. Declining real median household income, even in this recovery, is depressing consumer- spending power. The same is true of income polarization because high earners are less likely to spend their money than people with lower incomes. According to the Federal Reserve’s Survey of Consumer Finances, real median net worth fell 39 percent from 2007 to 2010, the latest available data, yet income polarization caused the mean to fall just 20 percent. In 1989, mean consumer net worth was four times the median. It jumped to 6.5 times the median in 2010. Increasing protectionism also slows global economic growth. A recent survey of 3,000 business executives in 25 countries commissioned by General Electric Co. (GE) found that 71 percent wanted governments to protect and encourage domestic innovation. Global trade-liberalization deals have been largely abandoned in favor of bilateral agreements and narrow compacts in environmentally friendly technologies and other areas. Competitive Devaluations Competitive devaluations are now a serious threat to global growth and cooperation, as shown by the actions of Prime Minister Shinzo Abe’s new government in Japan. In periods of prolonged economic pain, notably the global recession of 2007-2009 and the subpar revival that has followed, international cooperation gives way to an every-nation-for- itself attitude that often takes the form of protectionism. Many countries are now pursuing competitive devaluations to spur exports via a cheaper currency and to impede imports. When all nations competitively devalue, they all lose because foreign trade is disrupted and economic growth is depressed. But that doesn’t stop countries from trying to get an edge. Most, however, will probably end up devaluing against the U.S. dollar, the premier currency. Commodity Deflation: On balance, commodity prices have been falling since early 2011. They will continue to drop, especially if a shock, such as a Middle East crisis, drives up oil prices. Prices for industrial commodities should be further depressed by rising inventories. After the earlier drought- related surge in grain prices, farmers in the U.S. and elsewhere will plant more, and can expect record harvests in 2013, weather permitting. This may help explain the recent decline in grain prices. As for crude oil, I believe the “peak oil” devotees are far too pessimistic. High prices are the best predictor of increasing supply. Technological improvements are making it easier to discover new fields and to increase production from existing ones. Hydraulic fracturing and other new technologies for extracting natural gas from shale have increased supply and lowered prices. Wage and Income Deflation: The continuing decline in purchasing power produced by shrinking real wages and real incomes is also putting downward pressure on prices. Nominal pay is dropping, too. For about a third of those who find jobs after being unemployed six months or more, the new position pays less than the last job held. This is primarily the result of the recession and the sputtering recovery that slashed demand for labor. Globalization, which moves production to lower-cost locales, also plays a role. Furthermore, U.S. businesses are using cost cutting to improve profit margins rather than using pricing power and sales-volume growth. Labor Power The downward pressure on compensation is connected to the rapid erosion of labor-union power. In 2012, unions lost 400,000 members, or 2.7 percent, and their representation in the labor force fell to 9.3 percent, from 9.6 percent in 2011 and more than 25 percent in the 1960s. In the private sector, unionization fell to 6.3 percent, with the sharpest declines in manufacturing and construction. More states are passing right-to-work laws, which allow employees in unionized workplaces to opt out of paying union dues. In the past year, private-sector employees in right-to- work states earned 9.8 percent less than workers in other states. Manufacturing jobs pay 7.4 percent less in right-to-work states. On the other hand, the number of jobs in such states grew 4.9 percent in the past three years, compared with 3.9 percent in non-right-to-work states. Municipal governments are under pressure to cut costs. Local tax collection is subdued because of earlier declines in property assessments and taxes, which account for 79 percent of revenue. State tax collections have revived, thanks to increases in corporate and personal income taxes and in sales taxes. Yet many states still face budget problems because of the fading effects of the federal stimulus enacted in 2009, which was used for infrastructure projects and to preserve teachers’ jobs. In addition, the Medicaid costs borne by the states are ballooning, and temporary taxes instituted during the recession are expiring. Vastly underfunded defined-benefit pensions are also fueling state and local government retrenchment. In response, many states continue to cut spending and jobs. emplLabor costs, which account for half of state and local spending, are being target because of their total size and because government edoyees are paid 44 percent more on average than private-sector workers, 32 percent more in wages and 71 percent more in benefits per hour worked. In terms of income, this implies that the loss of two state and local jobs is equivalent to almost three layoffs in the private sector. (A. Gary Shilling is president of A. Gary Shilling & Co. and the author of “The Age of Deleveraging: Investment Strategies for a Decade of Slow Growth and Deflation.” The opinions expressed are his own. This is the first in a five-part series.) www.bloomberg.com/news/2013-03-20/why-global-economies-face-an-age-of-deflation.html |
|
|
|
Post by jeffolie on May 20, 2013 13:12:48 GMT -6
Velocity, Slow Money & inflation, next 2 years Why has inflation as published by the lying govt and repeated across the world remained so tame, low in America?The below piece states an often published fear of upcoming high inflation which well published John Williams of Shadowstats has warned often will become hyperinflation by the end of 2014 revised from his prior warning that hyperinflation would start THIS YEAR. Below, Bruce Krasting warns that when velocity ... money turnover ... jumps, then inflation will explode. my jeffolie view: low or no inflation during 2013 & 2014 in America... inflation will come from a Dollar crisis after the EU crisis first and most likely the EU crisis will start late in 2013 or in 2014 because Germany has elections in Sept 2013. =================================== Slow Money - Big Money by Bruce Krasting on 03/08/2013 Supply Money Velocity Recession With the DOW blowing by milestones I went looking for other things that were at record levels. The first one that I looked at was M2. No surprise at all, M2 is bigger than ever. Charts of the long and short term trajectory of money supply: brucekrasting.com/wp-content/uploads/2013/03/Screen-Shot-2013-03-08-at-12.57.43-PM.png The money supply is $3T higher than it was at the start of the 2008 recession. GDP is up $2T. brucekrasting.com/wp-content/uploads/2013/03/Screen-Shot-2013-03-08-at-12.58.59-PM.png There is another component of M2. It has me baffled. It too is at a record. In this case it's a record low. I'm sure this important. I don't know why it's happening. I don't know what the consequences of this will be. This chart is screaming something: brucekrasting.com/wp-content/uploads/2013/03/Screen-Shot-2013-03-08-at-1.01.33-PM.png My thoughts on the chart: - It's fairly clear that sharp declines in the velocity of money is consistent with periods of recession. But.. - If recessions are the cause of the decline in velocity, what the heck is going on today? We are now three years out of recessions, and velocity keeps dropping. - Behind each of the recessions is the Federal Reserve. To offset a slowdown in the economy, it drops interest rates. When interest rates fall, velocity declines. - As interest rates have been forced to zero for years past the last recession, the velocity of money has continued to decline. - There are no periods in history where sustained economic expansion has occurred while money velocity is declining. If you buy into my (admittedly un-scholarly) assessment of money velocity, then you might conclude: * The Fed's ZIRP policy has outlived its usefulness as a policy tool. * The Fed's policy on Forward Guidance for short-term interest rates (another two years of ZIRP) is accelerating the decline in money velocity, and therefore counter productive. Clearly, Bernanke and the other Fed Doves don't think there is a connection between record low money velocity and ZIRP. In fact, they must believe precisely the opposite. These folks are aware of the collapse in velocity, they know that this drop is a drag on the economy (particularly inflation), yet they have committed themselves to a policy that (IMHO) insures that money velocity stays historically low. Go figure. One final thought on money velocity - it will return to a more normal level at some point. This may not happen until years into the future when monetary policy goes off "Fast Forward". But it will happen. When it does, the high octane gas that is now M2 and not moving; will become the bloated M2 that is moving. Another dumb question comes to mind.: The Fed has said that it will not back off until inflation gets to 3%. But when the Fed does back off, money velocity should accelerate very quickly - and this should give inflation another big boost. So when the Fed finally does respond to rising inflation, its actions will light a fuse on more inflation. The Fed Doves are not thinking of that scenario. If they did, they would be not so confident in their ability to control the outcome. That, or they're bluffing www.zerohedge.com/contributed/2013-03-08/slow-money-big-money... below inflation advocates argue that inflation will come. I disagree until a 'political decision' happens to cause inflation by getting money into the Type 2 consumers hands ... the opposite now exists with declining median incomes.I agree inflation exists in very narrow selective assets such as fine art, secluded security real estate, stocks, bonds ... all assets held only in the small group of rich consumers my labels have as Type 1 upper 20% of incomes/wealth. Velocity, Slow Money & inflation, next 2 years Why has inflation as published by the lying govt and repeated across the world remained so tame, low in America?The below piece states an often published fear of upcoming high inflation which well published John Williams of Shadowstats has warned often will become hyperinflation by the end of 2014 revised from his prior warning that hyperinflation would start THIS YEAR. Above, Bruce Krasting warns that when velocity ... money turnover ... jumps, then inflation will explode. my jeffolie view: low or no inflation during 2013 & 2014 in America... inflation will come from a Dollar crisis after the EU crisis first and most likely the EU crisis will start late in 2013 or in 2014 because Germany has elections in Sept 2013. ====================================== Velocity of Money and the Crack-Up Boom by John Rubino on May 18, 2013 Based on both recent history and mainstream economic theory the past few years should not have been possible. When you cut interest rates to near-zero, run deficits of 10% of GDP and buy up every government bond in sight with newly created currency, you get a boom, end of story. That’s just the way capitalism works. But this time was different. After four years of QE and ZIRP and all the other easy-money acronyms, we entered the month of May with Europe in a deepening recession and the US recovery petering out. The culprit? The one piece of the puzzle that governments can’t control: the velocity of money. This is simply a measure of how quickly holders of currency, i.e., banks, consumers, businesses, hand their currency off to someone else. The faster and more frequent the hand-offs, the more stuff gets bought and the more robustly an economy grows. But after their 2009 near-death experience, the world’s banks have been in no mood to lend. Instead, they’ve been sticking all the new currency their governments have been giving them under the proverbial mattress. This reluctance to lend means record low money velocity and little or no economic growth. 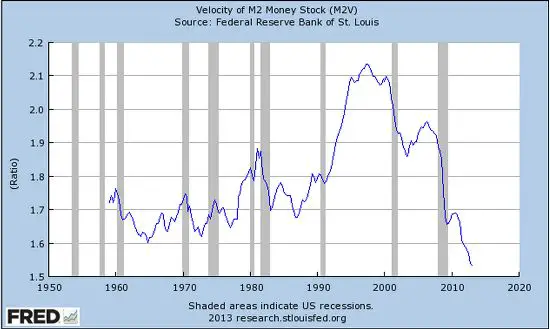 dollarcollapse.com/wp-content/uploads/2013/05/Velocity-of-money-2013.jpgBut in just the past month something fundamental has changed. US home sales and prices have accelerated, with prices returning to 2006 levels in some markets and bidding wars, flippers and interest-only mortgages once again becoming common. Stock prices pierced old records and then spiked rather than corrected. Suddenly we’re back in an asset-driven boom. dollarcollapse.com/wp-content/uploads/2013/05/Velocity-of-money-2013.jpgBut in just the past month something fundamental has changed. US home sales and prices have accelerated, with prices returning to 2006 levels in some markets and bidding wars, flippers and interest-only mortgages once again becoming common. Stock prices pierced old records and then spiked rather than corrected. Suddenly we’re back in an asset-driven boom. But it’s a boom with a twist because it coincides with unprecedented amounts of “excess reserves” in the banking system. This is the raw material for new loans, and banks across the country are worrying that they’re missing the boat by remaining in cash. Marginal mortgage applicants now look a lot more attractive because their collateral is appreciating. Private businesses, judged by the share prices of their publicly-traded peers, are becoming more valuable and hence more creditworthy. Families with rising stock portfolios and appreciating houses suddenly look like better bets for car loans. So what happens if a tidal wave of bank reserves are suddenly converted to business and consumer loans at a time when asset markets are already overheated? Maybe the fabled crack-up boom of Austrian economics. A couple of weeks ago Daily Reckoning addressed this issue in an article that quoted Ludwig von Mises’ famous definition of a crack-up boom: This first stage of the inflationary process may last for many years. While it lasts, the prices of many goods and services are not yet adjusted to the altered money relation. There are still people in the country who have not yet become aware of the fact that they are confronted with a price revolution which will finally result in a considerable rise of all prices, although the extent of this rise will not be the same in the various commodities and services. These people still believe that prices one day will drop. Waiting for this day, they restrict their purchases and concomitantly increase their cash holdings. As long as such ideas are still held by public opinion, it is not yet too late for the government to abandon its inflationary policy. But then, finally, the masses wake up. They become suddenly aware of the fact that inflation is a deliberate policy and will go on endlessly. A breakdown occurs. The crack-up boom appears. Everybody is anxious to swap his money against ‘real’ goods, no matter whether he needs them or not, no matter how much money he has to pay for them. Within a very short time, within a few weeks or even days, the things which were used as money are no longer used as media of exchange. They become scrap paper. Nobody wants to give away anything against them. It was this that happened with the Continental currency in America in 1781, with the French mandats territoriaux in 1796, and with the German mark in 1923. It will happen again whenever the same conditions appear. If a thing has to be used as a medium of exchange, public opinion must not believe that the quantity of this thing will increase beyond all bounds. Inflation is a policy that cannot last. So how close are we to the point where “finally, the masses wake up?” Hard to say. Stocks and houses are back at previous-bubble levels and there’s even talk of a shortage of government bonds. And based on the excited emails pouring in from people who, after a decade of bad returns have seen their aggressive growth funds rise by 25% in a quarter and are feeling like geniuses, animal spirits are back and happy. All while bank lending has barely started to ramp up. It’s safe to assume that banks getting into the game would heat the markets up even more. How would today’s financial system handle the resulting volatility? Prudent Bear’s Doug Noland addresses this in his most recent Credit Bubble Bulletin: I don’t mean to imply that today’s environment is comparable to 1999. The U.S. economy was sounder in 1999 – and the global economy was a whole lot more stable. Global imbalances in 1999 were insignificant compared to the present. The U.S. economic and Credit systems had yet to be degraded by a doubling of mortgage debt and a massive misallocation of resources. The federal government hadn’t doubled its debt load in four years. Europe had not yet terribly impaired itself with a decade of runaway non-productive debt growth. China and the “developing” economies had not yet succumbed to historic Credit booms, overinvestment and economic maladjustment. Central banks hadn’t yet resorted to really dangerous measures. The implication: This world, levered to the hilt in response to the policy mistakes and financial crises of the past few decades, is more complex and fragile than the systems that (barely) survived the bursting of the tech stock and housing bubbles. So this bubble and its aftermath might be a whole different animal. dollarcollapse.com/inflation/velocity-of-money-and-the-crack-up-boom/ |
|
|
|
Post by jeffolie on Jul 14, 2013 12:38:14 GMT -6
QE, The Velocity of Money And Dislocated Gold JULY 08, 2013 From time to time, it's nice to look at a series of graphs, and let them tell their thousand words worth - each - of stories. In this case, I started out looking at US monetary base at the St.Louis Fed website and it sort of went from there. Curious trends and intriguing numbers, beyond what I would have thought. To refresh memory and avoid confusion, first a few definitions: The monetary base - base money, money base - is the sum of currency circulating in the public and commercial banks' reserves with the central bank. The money supply - money stock -, on the other hand, is the sum of currency circulating in the public and non-bank deposits with commercial banks, a.k.a. the total amount of monetary assets available in an economy at any given time. Some additional useful definitions from Wikipedia: " ... the ratio of [the monetary base and the money supply] is referred to as the money multiplier. If one excludes currency from the definitions, the monetary base is not a subset of the money supply - rather, the two are disjoint sets. On the commercial banks' balance sheets, the former belongs to the assets whereas the latter belongs to the liabilities. • M1: The total amount of M0 (cash/coin) outside of the private banking system plus the amount of demand deposits, travelers checks and other checkable deposits • M2: M1 + most savings accounts, money market accounts, retail money market mutual funds, and small denomination time deposits (certificates of deposit of under $100,000). Ironically, Wikipedia also states: "Normally, the money supply exceeds the monetary base by far...". Well, we're not in Kansas anymore. Two M1 graphs that I posted before in Deflation By Any Other Name Would Smell As Foul tell a first part of the story:  4.bp.blogspot.com/-uwiZlEcbH4k/UcltT7XfDWI/AAAAAAAAKKk/Z7dbvTr7We4/s1600/M1MoneyStock.png 4.bp.blogspot.com/-uwiZlEcbH4k/UcltT7XfDWI/AAAAAAAAKKk/Z7dbvTr7We4/s1600/M1MoneyStock.png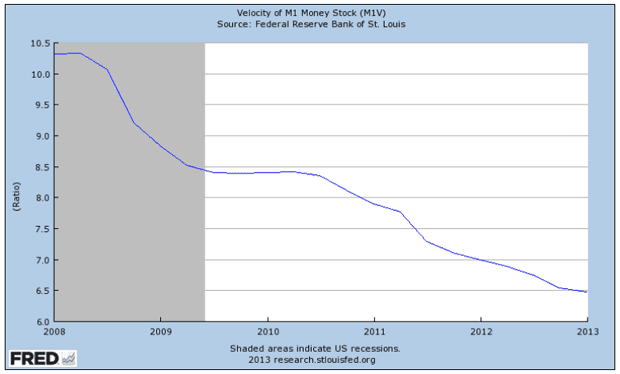 Of course, more information than from just M1 can be derived from M2, where the money supply looks different (no sudden shrinkage): 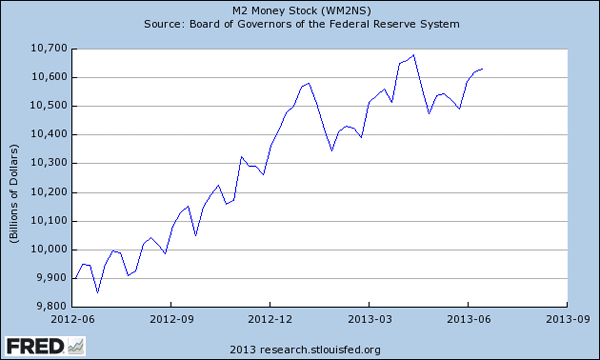 2.bp.blogspot.com/-fHcorBpyFqc/UdlqFxCOw0I/AAAAAAAAKXg/19bQCBaro2M/s1600/M2MoneyStock.png 2.bp.blogspot.com/-fHcorBpyFqc/UdlqFxCOw0I/AAAAAAAAKXg/19bQCBaro2M/s1600/M2MoneyStock.png But the velocity does not (Do note the different time scales for these and other graphs):  1.bp.blogspot.com/-JBAO0U7i_LI/UdlqGPtnkWI/AAAAAAAAKXk/FODBgPlTwYA/s1600/M2Velocity.png 1.bp.blogspot.com/-JBAO0U7i_LI/UdlqGPtnkWI/AAAAAAAAKXk/FODBgPlTwYA/s1600/M2Velocity.png Even more interesting than the money supply, however, is the monetary base (I used a very long timeline to show how out of - historical - proportion it has gotten):  4.bp.blogspot.com/-X_T0TwSgGVA/UdlelwDIGpI/AAAAAAAAKXM/_biuZqCxjHY/s1600/M2MonetaryBase.png 4.bp.blogspot.com/-X_T0TwSgGVA/UdlelwDIGpI/AAAAAAAAKXM/_biuZqCxjHY/s1600/M2MonetaryBase.png And it gets real curious when we put monetary base and M2 Velocity together: 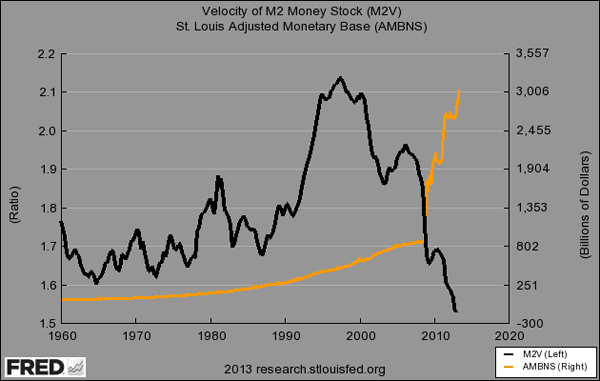 1.bp.blogspot.com/-Rn_0x39XvIw/UdqZ50RTDRI/AAAAAAAAKYI/M9Wv7AzedSk/s1600/M2Velocity2.png 1.bp.blogspot.com/-Rn_0x39XvIw/UdqZ50RTDRI/AAAAAAAAKYI/M9Wv7AzedSk/s1600/M2Velocity2.png Velocity rose like crazy in the '90s. Ever since, the Fed, the government and the entire economy have basically been pushing on a string (or have they?). Velocity hasn't been this low in 50-odd years, since it started being recorded (and that included quite a few other crises). But $2.2 trillion in stimulus, much of it QE, has found its way from the Fed into the reserve accounts the major global banks have with the same Fed. And it's not moving one inch. Indeed, these banks, who got the funds from the Fed, are receiving interest payments on them from that very same Fed. So has Bernanke been pushing on a string? Well, if and when the velocity of money plummets the way the graphs show, it's obvious nothing is helping to get the QE funds into the real economy. Bernanke knows this, and he too has seen the graphs and the trendlines. But he still continues to pour $1 trillion per year into this same sinkhole. What it then comes down to may be that while the Fed can claim innocence and say it only tried to energize the economy, that is all just sleight of hand. Because this looks a lot like one huge money transfer from the public to the private sector, and one that has little to no chance of achieving the advertised goals. The net effect, if this continues, will be to further bankrupt an already bankrupt society. If you look at it that way, it no longer appears so innocent. If anything, it looks an awful lot like Japan. And that means all the news reports that suggest an improving US economy need to be taken with a whole lot of roadsalt: there can be no economic recovery with a plunging money velocity. And whatever Bernanke may claim he has done about that, even if he actually tried, nothing has worked. Another way to look at it is through this H.8;Zero Hedge graph, which compares total bank deposits with loans (left scale). Until 2008, they ran together, but ever since, a $2 trillion gap was established (right scale). Take it one step further and you could say that with a 10% reserve requirement, banks could potentially lend out $20 trillion. But they don't. Moreover, unless deposits include the QE money banks have parked at the Fed (but that would be weird), they've not just seen the deposits/loans gap grow by $2 trillion, they also acquired another $2 trillion in QE from the Fed. $4 trillion available, but no change in credit for the real economy. What do you call that, nice job if you can get it?! Or is it something worse? , but no change in credit for the real economy. What do you call that, nice job if you can get it?! Or is it something worse?  3.bp.blogspot.com/-raX-JA4Vczw/UdlemBvGa2I/AAAAAAAAKXI/F2n2N8fLRvE/s1600/ZHDepositsAndLoansUS.jpg 3.bp.blogspot.com/-raX-JA4Vczw/UdlemBvGa2I/AAAAAAAAKXI/F2n2N8fLRvE/s1600/ZHDepositsAndLoansUS.jpg The dislocation between loans and deposits is not the only one of its kind. Another thing that struck me when flipping through these graphs concerns the "dislocation" between the monetary base and gold prices. The graph below (I forget where I found it) shows the tight correlation between the two from 2008 until 2012 (and a somewhat looser correlation before).  4.bp.blogspot.com/-XBiylMmllUg/UdlelajK4wI/AAAAAAAAKW0/OTaGCttP_2U/s1600/GoldAndUSMonetaryBase.png 4.bp.blogspot.com/-XBiylMmllUg/UdlelajK4wI/AAAAAAAAKW0/OTaGCttP_2U/s1600/GoldAndUSMonetaryBase.png But if we look once more at the monetary base graph from before, we see it surged a lot more from where the graph just above left off (early 2012): 4.bp.blogspot.com/-X_T0TwSgGVA/UdlelwDIGpI/AAAAAAAAKXM/_biuZqCxjHY/s1600/M2MonetaryBase.png While gold has moved sharply in the opposite direction:  4.bp.blogspot.com/-LqBZmWTjlik/UdlelYzFB2I/AAAAAAAAKWw/DRJTWmwHcm4/s1600/FREDGoldFixingPrice.png 4.bp.blogspot.com/-LqBZmWTjlik/UdlelYzFB2I/AAAAAAAAKWw/DRJTWmwHcm4/s1600/FREDGoldFixingPrice.png I don't claim to know exactly what this gold/monetary base dislocation is telling us, but it does look significant. Did central banks sell off gold, in which case it's pretty straightforward, or was it someone else? We do know that wherever the difference went, it wasn't stocks or bonds. Nor is there any other obvious place it went to. It may well have simply vanished, in a strong bout of deleveraging (debt deflation). What I think should be crystal clear is that Ben Bernanke must be forced to stop his QE policies. It is abundantly obvious that none of it helps the real economy one iota, and if it doesn't help, it hurts. I've read it estimated that 86% of QE has so far ended up in banks' reserves with the Fed, and for all I can see it may be even worse. That is not an economic stimulus, it's something entirely different. If only 1 in 7 dollars spent has any effect on Main Street at all, it is at best the proverbial "throw it at the wall and see what sticks". Lest we forget, consumers still make up 70% of GDP, and if you want to know how that is going, you need look no further than the stats on the velocity of money. Ben Bernanke and his Fed must be aware of this, which means that what they have been doing for the past five years is either very dumb or very devious. Take your pick. theautomaticearth.com/Finance/qe-the-velocity-of-money-and-dislocated-gold.html |
|
|
|
Post by unlawflcombatnt on Jul 14, 2013 22:10:05 GMT -6
It IS worse. It's an upward transfer of wealth. As stated earlier, it's a huge transfer of wealth from the public sector (taxpayer-funded) to the private sector.
|
|
|
|
Post by jeffolie on Jul 15, 2013 10:50:29 GMT -6
It IS worse. It's a an upward transfer of wealth. As stated earlier, it's a huge transfer of wealth from the public sector (taxpayer-funded) to the private sector. I agree ... at some point soon [months] the existing method of enriching the rich, Type 1 consumer will fail: when stocks decline, house prices decline This topping phase has started with higher interest rates...peaking stocks phase over months most likely starts in 2 weeks, end of month, next month
Trickle Down always failed historically leading to a 2 year crash in markets and significant Depression ... a new Great Depression about 2016 lasting many years or even decades |
|

