|
|
Post by jeffolie on May 31, 2013 13:16:56 GMT -6
No Income, No Spending Denninger focused on the dog, not the rich tail of the dog. Denninger ignores the split between spending by the rich, Type 1 consumer who buys new cars and houses to rehab into rental income compared to the rest, the 80%, Type 2 consumers suffering a 'regular depression' with suicides, crashing birthrates, declining real median income, higher living expenses as 'screwflation'. America remains a 'don't fight the FED' economy where higher stocks and higher house prices motive the Trickle Down car purchases.Below Denninger ignored that car buying declined ... Trickle Down declined in April. and rental income declined. =================================== No Income, No Spending 2013-05-31 09:02 by Karl Denninger No Income, No Spending One month does not make a trend. But if this is a trend..... Personal income decreased $5.6 billion, or less than 0.1 percent, and disposable personal income (DPI) decreased $16.1 billion, or 0.1 percent, in April, according to the Bureau of Economic Analysis. Personal consumption expenditures (PCE) decreased $20.5 billion, or 0.2 percent. In March, personal income increased $36.2 billion, or 0.3 percent, DPI increased $25.4 billion, or 0.2 percent, and PCE increased $14.2 billion, or 0.1 percent, based on revised estimates.Uh huh. Here's the problem -- roughly $1 trillion in monetary dilution against a $15 trillion economy is ~ 7% dilution in purchasing power annually. This means that personal income and spending must increase at least 7% in dollar terms simply to be even at the consumer level. For the last couple of years what we keep hearing is how it's "awful" that we're not getting real employee growth, real small business growth, real anything. Instead we see these "anemic" figures month after month with wobbles toward negative outright figures. Nobody is talking about the monetary reality, which is that trying to boost "nominal" income, investment and spending through government credit expansion has not worked for the last five years. This is the fundamental disconnect in the economy .vs. the markets. The markets have priced in an expansion that hasn't happened. The consumer has been propped up through transfer payments of various sorts along with people spending what would otherwise be mortgage payments. All of these distortions have create a mirage -- a belief in a "recovery" that never actually happened. The employment population ratio does not lie and it, along with these figures adjusted for currency debasement are well into raw Depression territory. There are those who believe that The Fed can continue these games forever and that the check will never have to be paid -- or at least not in our lifetimes. I will close by reminding everyone that this is exactly what was believed in the tech industry in late 1999 and housing in 2007. How did it turn out? market-ticker.org/akcs-www?post=221273 |
|
|
|
Post by jeffolie on May 31, 2013 13:17:44 GMT -6
The economic, broadly viewed US activity is declining. " ... U.S. consumers reduce spending in AprilBiggest drop in almost a year tied to lower car sales, energy costs The car buying failed. Why? The Type 1, rich consumer retreated along with the peaking housing recovery as the rental market peaked resulting in the failing Trickle Down spending. STOCK MARKETThe stock market is forming a broad top ... the current, most recent short term top most likely started a pattern ... often these appear to be 3 peaks over months, upto 1 year. ================================================= May 31, 2013 U.S. consumers reduce spending in AprilBiggest drop in almost a year tied to lower car sales, energy costs WASHINGTON (MarketWatch) — Consumers reduced spending in April at the fastest rate in almost a year and income growth softened, but lower inflation also gave them more bang for their buck, according to the latest government figures. Consumer spending fell a seasonally adjusted 0.2% last month, the Commerce Department said Friday. Economists polled by MarketWatch had expected a 0.1% decrease. The decline likely stemmed from fewer auto purchases in April and less spending on gasoline and other fuels. Auto sales, though still strong, dropped last month to the lowest pace since last fall, and Americans spent less to fill up their gas tanks and heat their homes as energy prices fell. Soft consumer spending in April points to a weaker reading on U.S. gross domestic product in the second quarter, barring a sharp uptick in May and June. Consumer spending accounts for as much as 70% of economic activity and is the gateway to faster growth. When Americans buy more goods and services, businesses generate higher sales and profits and can afford to hire extra workers. Income growth, meanwhile, was flat in April, mostly because of lower rents and farm earnings. Wages actually rose slightly, even in the government sector, despite a decline in hours worked. Many companies reduced the number of hours that employees worked last month, partly reflecting the onset of the so-called sequester. The federal law cuts billions in federal spending and most government agencies have required employees to take unpaid furloughs. Despite the decline in consumer spending, the savings rate of Americans held steady at 2.5% and remained near a five-year low. The big question is whether households move to further cut spending and rebuild their savings, but so far there’s little evidence. In the first quarter consumer spending actually rose at the fastest pace in more than two years. Lower energy prices and falling inflation, what’s more, should give consumers a bit more cushion. The PCE inflation index declined by 0.3% in April, and it’s up just 0.7% over the past 12 months. That’s the lowest rate since October 2009. Low inflation gives consumers more buying power and makes every dollar go further. The core PCE rate, which excludes food and energy, was flat in April, and it’s up 1.1% in the past year. That’s the lowest level since March 2011 and just a notch above an all-time low. Adjusted for inflation, disposable income declined by 0.1% last month. Disposable income is the money left after people pay taxes www.marketwatch.com/story/us-consumers-reduce-spending-in-april-2013-05-31?link=MW_home_latest_news |
|
|
|
Post by unlawflcombatnt on Jun 1, 2013 7:39:06 GMT -6
I just couldn't let this falsehood go.
Being able to "afford to hire extra workers" has got NOTHING to do with it.
It's the demand for goods the workers produce that causes hiring of extra workers, not their "affordability."
Companies don't hire more workers simply because they can afford them.
They hire them ONLY when they need them to produce more goods--to make more money for the company through sale of those additional goods produced.
Affordability does not dictate hiring.
Demand does.
|
|
|
|
Post by jeffolie on Jun 1, 2013 9:12:09 GMT -6
I just couldn't let this falsehood go. Being able to "afford to hire extra workers" has got NOTHING to do with it. It's the demand for goods the workers produce that causes hiring of extra workers, not their "affordability." Companies don't hire more workers simply because they can afford them. They hire them ONLY when they need them to produce more goods--to make more money for the company through sale of those additional goods produced. Affordability does not dictate hiring. Demand does. I agree. Unfortunately, demand creating more sales can mean more hiring in Bangaladash, China, India, Phillipines, Brazil ... America's labor parcticipation continues to collapse |
|
|
|
Post by unlawflcombatnt on Jun 1, 2013 22:38:08 GMT -6
I just couldn't let this falsehood go. Being able to "afford to hire extra workers" has got NOTHING to do with it. It's the demand for goods the workers produce that causes hiring of extra workers, not their "affordability." Companies don't hire more workers simply because they can afford them. They hire them ONLY when they need them to produce more goods--to make more money for the company through sale of those additional goods produced. Affordability does not dictate hiring. Demand does. I agree. Unfortunately, demand creating more sales can mean more hiring in Bangaladash, China, India, Phillipines, Brazil ... America's labor parcticipation continues to collapse Yes. Those workers are more "affordable". |
|
|
|
Post by jeffolie on Aug 8, 2013 13:03:44 GMT -6
August 07, 2013 US Consumer Spending Flat Since March - Gallup A Gallup Poll headline says "U.S. Self-Reported Spending Flat Since May" However, the charts show stagnation since March. Let's take a look. U.S. self-reported daily consumer spending was $89 in July, unchanged from the $90 of June and May. The relatively flat spending levels of the past five months are consistent with the weak GDP reports of the past three quarters and the lack of improvement Gallup finds in its Payroll to Population employment rate over the past couple of years. 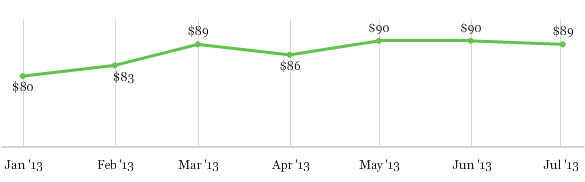 2.bp.blogspot.com/-DmN0Sz65O7Y/UgHrlHEyICI/AAAAAAAAWxI/6et23ACel5U/s1600/Gallup+Spending+2013-08.png 2.bp.blogspot.com/-DmN0Sz65O7Y/UgHrlHEyICI/AAAAAAAAWxI/6et23ACel5U/s1600/Gallup+Spending+2013-08.pngTrend in Self-Reported Spending Spending began the year at $80 in January and $83 in February. Consumers opened their wallets some more in March, spending an average of $89, reflecting the normally expected seasonal spring increase in sales. However, consumer spending has remained basically at that level since -- in the face of what are normally positive seasonal factors such as warmer weather, home improvement projects, and spring and summer travel. Longer-term, Americans' self-reported spending is much stronger than it was from late 2008 to late 2011, but continues to trail early 2008, before the recession gained momentum. Spending Across Income Levels Also Relatively Flat Upper-income spending inched up to $158 in July, from $143 in June and $150 in May. But the upper-income spending data tend to be more volatile due to the smaller sample sizes involved, and the overall trend seems to be essentially flat over the past five months -- with a peak of $166 in March and a low of $140 in April. Lower- and middle-income spending averaged $78 per day in July, similar to the $77 per day in June and May, and the $75 in March. Spending by this group in 2013 has been in a relatively narrow range, from a high of $78 last month to a low of $70 in January. Survey Question The survey question was "Not counting the purchase of a home or vehicle or your normal household bills, how much money did you spend or charge yesterday on all other types of purchases you may have made such as at a store, restaurant, online, or elsewhere?" In simple terms, Gallup was checking up on self-reported consumer discretionary spending. Conclusions Even as Wall Street is reaching new record highs, questions remain about the strength of the Main Street economy. Gallup's self-reported spending results for July suggest the underlying economy remains fragile at best. This aligns with recent weak GDP reports, the lack of increase in full-time jobs with employers, the slight decline in economic confidence, and Friday's mixed, but also relatively weak, Bureau of Labor Statistics jobs report. The reason spending hasn't in fact declined over the past several months may be that the Federal Reserve's efforts to flood the economy with money have not only been supportive of Wall Street, but also bolstered durable goods values in general, including housing and autos. Still, at this point, Gallup's economic data do not support the idea of a significantly improving U.S. economy in the second half of the year. In turn, this suggests retailers may be disappointed with the Back-to-School spending season.
I agree with the above conclusions, written by Dennis Jacobe, Chief Economist for Gallup. Mike "Mish" Shedlock Read more at globaleconomicanalysis.blogspot.com/#SdV7CSxBCS7z2932.99 |
|

