|
|
Post by jeffolie on Jun 1, 2013 10:30:03 GMT -6
|
|
|
|
Post by jeffolie on Jun 2, 2013 15:44:26 GMT -6
Schedule for Week of June 2nd by Bill McBride on 6/01/2013 The key report this week is the May employment report on Friday. Other key reports include the ISM manufacturing index on Monday, auto sales also on Monday, the Trade Balance report on Tuesday, and the ISM service index on Wednesday. Also, the Federal Reserve will release the Q1 Flow of Funds report on Thursday. ----- Monday, June 3rd ----- 9:00 AM: The Markit US PMI Manufacturing Index for May. The consensus is for the index to be unchanged at 52.1. 10:00 AM ET: ISM Manufacturing Index for May. The consensus is for an increase to 51.0 from 50.7 in April. Based on the regional surveys, a reading at or below 50 is possible. Here is a long term graph of the ISM manufacturing index. The ISM manufacturing index indicated expansion in April at 50.7%. The employment index was at 50.2%, and the new orders index was at 52.3%. 10:00 AM: Construction Spending for April. The consensus is for a 1.0% increase in construction spending. All day: Light vehicle sales for May. The consensus is for light vehicle sales to increase to 15.2 million SAAR in May (Seasonally Adjusted Annual Rate) from 14.9 million SAAR in April. This graph shows light vehicle sales since the BEA started keeping data in 1967. The dashed line is the April sales rate. ----- Tuesday, June 4th ----- 8:30 AM: Trade Balance report for April from the Census Bureau. Exports declined slightly in March, and imports declined even more, so the deficit declined. The consensus is for the U.S. trade deficit to increase to $41.2 billion in April from $38.8 billion in March. ----- Wednesday, June 5th ----- 7:00 AM: The Mortgage Bankers Association (MBA) will release the results for the mortgage purchase applications index. 8:15 AM: The ADP Employment Report for May. This report is for private payrolls only (no government). The consensus is for 171,000 payroll jobs added in May. 10:00 AM: ISM non-Manufacturing Index for May. The consensus is for a reading of 53.8, up from 53.1 in April. Note: Above 50 indicates expansion, below 50 contraction. 10:00 AM: Manufacturers' Shipments, Inventories and Orders (Factory Orders) for April. The consensus is for a 1.4% increase in orders. 2:00 PM: Federal Reserve Beige Book, an informal review by the Federal Reserve Banks of current economic conditions in their Districts. ----- Thursday, June 6th ----- 8:30 AM: The initial weekly unemployment claims report will be released. The consensus is for a decrease to 345 thousand from 354 thousand last week. 10:00 AM: Trulia Price Rent Monitors for May. This is the index from Trulia that uses asking house prices adjusted both for the mix of homes listed for sale and for seasonal factors. 12:00 PM: Q1 Flow of Funds Accounts of the United States from the Federal Reserve. ----- Friday, June 7th ----- 8:30 AM: Employment Report for May. The consensus is for an increase of 167,000 non-farm payroll jobs in May; the economy added 165,000 non-farm payroll jobs in April. The consensus is for the unemployment rate to be unchanged at 7.5% in May. The following graph shows the percentage of payroll jobs lost during post WWII recessions through April. The economy has added 6.8 million private sector jobs since employment bottomed in February 2010 (6.2 million total jobs added including all the public sector layoffs). There are still 2.0 million fewer private sector jobs now than when the recession started in 2007. 3:00 PM: Consumer Credit for April from the Federal Reserve. The consensus is for credit to increase $14.0 billion in April. Read more at www.calculatedriskblog.com/2013/06/schedule-for-week-of-june-2nd.html#UUr8MsOYsM0gVlOF.99 |
|
|
|
Post by jeffolie on Jun 3, 2013 9:03:41 GMT -6
Huge Manufacturing ISM Miss And Lowest Print Since June 2009 Sends Markets Soaring06/03/2013 So much for the Chicago PMI 8 Sigma renaissance. Moments ago the Manufacturing ISM came out and confirmed that all those "other" diffusion indices were correct, except for the "data" out of Chicago (yes, shocking). Printing at a contractionary 49.0, this was a drop from 50.7, well below expectations of 51.0 (and far below the cartoonish Joe Lavorgna's revised 53.0 forecast). More importantly, this was the worst ISM headline print since June 2009, the first sub-50 print since November 2012, while the New Orders of 48.8, was the worst since July 2012. Both Production and Backlogs tumbled by -4.9 and -5.0 to 48.6, and 48.0 respectively. In brief, of the 11 series tracked by the ISM, only 3 posted a reading over 50 in May. This compares to just 2 out of 11 that were below 50 in April. Oh well, so much for this recovery. But the good news for the market is that today is really bad news is really good news day, and stocks have soared as according to the vacuum tubes, the result means no taper. The farce must go on. Visually:  www.zerohedge.com/sites/default/files/images/user5/imageroot/2013/06/20130602_ISM.jpg www.zerohedge.com/sites/default/files/images/user5/imageroot/2013/06/20130602_ISM.jpgAnd the breakdown:  www.zerohedge.com/sites/default/files/images/user5/imageroot/2013/06/ISM%20May.jpg www.zerohedge.com/sites/default/files/images/user5/imageroot/2013/06/ISM%20May.jpgFrom the report: The report was issued today by Bradley J. Holcomb, CPSM, CPSD, chair of the Institute for Supply Management™ Manufacturing Business Survey Committee. "The PMI™ registered 49 percent, a decrease of 1.7 percentage points from April's reading of 50.7 percent, indicating contraction in manufacturing for the first time since November 2012 and only the second time since July 2009. This month's PMI™ reading is at its lowest level since June 2009, when it registered 45.8 percent. The New Orders Index decreased in May by 3.5 percentage points to 48.8 percent, and the Production Index decreased by 4.9 percentage points to 48.6 percent. The Employment Index registered 50.1 percent, a slight decrease of 0.1 percentage point compared to April's reading of 50.2 percent. The Prices Index registered 49.5 percent, decreasing 0.5 percentage point from April, indicating that overall raw materials prices decreased from last month. Several comments from the panel indicate a flattening or softening in demand due to a sluggish economy, both domestically and globally." And the always gloomy respondents: •"Customers are anticipating resin price decreases and holding back orders." (Plastics & Rubber Products) •"Slight uptick in overall business but not substantial." (Textile Mills) •"Government spending has tightened, which has moved out program awards and caused some reduction in force." (Computer & Electronic Products) •"Market outlook is relatively flat, with some promise of raw materials inflation relaxing." (Electrical Equipment, Appliances & Components) •"General economy seems sluggish and pensive. Buyers are not buying much beyond lead times." (Fabricated Metal Products) •"Downturn in European and Chinese markets is having a negative effect on our business." (Machinery) •"We are having a difficult time hiring skilled employees." (Transportation Equipment) •"Business continues to increase, but over the past 20 days we have seen the trend flatten." (Furniture & Related Products) •"Market was holding strong until mid-month — then softened." (Wood Products) •"Decline in sales for FYQ2 over same period a year ago due to softer demand [in] both domestic and exports." (Chemical Products) and close-up - the sub-indices are not pretty either... New Orders 'swoon'ing again...  www.zerohedge.com/sites/default/files/images/user3303/imageroot/2013/06/20130602_ISM1.jpg www.zerohedge.com/sites/default/files/images/user3303/imageroot/2013/06/20130602_ISM1.jpg and Production at its lowest sicne May 2009...  www.zerohedge.com/sites/default/files/images/user3303/imageroot/2013/06/20130602_ISM2.jpg www.zerohedge.com/sites/default/files/images/user3303/imageroot/2013/06/20130602_ISM2.jpgand the market's "bad is good" reaction (for now)...  www.zerohedge.com/sites/default/files/images/user3303/imageroot/2013/06/20130602_ISM3.jpg www.zerohedge.com/sites/default/files/images/user3303/imageroot/2013/06/20130602_ISM3.jpg Charts: Bloomberg www.zerohedge.com/news/2013-06-03/huge-manufacturing-ism-miss-and-lowest-print-june-2009-sends-markets-soaring========================================= 2013-06-03 by Karl Denninger ISM: Goodnight (49%) This number sucks. The report was issued today by Bradley J. Holcomb, CPSM, CPSD, chair of the Institute for Supply Management™ Manufacturing Business Survey Committee. "The PMI™ registered 49 percent, a decrease of 1.7 percentage points from April's reading of 50.7 percent, indicating contraction in manufacturing for the first time since November 2012 and only the second time since July 2009. This month's PMI™ reading is at its lowest level since June 2009, when it registered 45.8 percent. The New Orders Index decreased in May by 3.5 percentage points to 48.8 percent, and the Production Index decreased by 4.9 percentage points to 48.6 percent. The Employment Index registered 50.1 percent, a slight decrease of 0.1 percentage point compared to April's reading of 50.2 percent. The Prices Index registered 49.5 percent, decreasing 0.5 percentage point from April, indicating that overall raw materials prices decreased from last month. Several comments from the panel indicate a flattening or softening in demand due to a sluggish economy, both domestically and globally." Oops. New orders, production, deliveries, inventories, customer inventories, prices, backlog -- all negative (under 50.) Employment was 50.1, edging down from 50.2 and flirting with negative territory. This is a crap report -- period -- and in addition posted up a bunch of "1"s on the trends (number of months in trend.) That is, a shift in trend. The regional fed surveys have pointed to trouble here for a while -- now it's becoming realized in the national data. I expect the market pumpers will try to spin this as "Fed will continue to pump in money" and likely bounce the market somewhat, but I'd be careful with the initial reaction -- there's an awful lot of crack smoking going on in the belief that The Fed can actually help the economy. After all, if they could with their bond-buying games, why haven't they? market-ticker.org/akcs-www?post=221364==================================== June 03, 2013 Huge Miss in May ISM; Manufacturing Now in Contraction; What the Numbers Mean US Manufacturing as measured by the May 2013 Manufacturing ISM Report On Business is treading water barely above contraction. Economic activity in the manufacturing sector contracted in May for the first time since November 2012, and the overall economy grew for the 48th consecutive month, say the nation's supply executives in the latest Manufacturing ISM Report On Business®. ISM at a Glance Series Data Apr Index Mar Index Percentage Point Change Direction Rate of Change Trend (Months) PMI™ 49.0 50.1 -1.7 Contracting From Growing 1 New Orders 48.8 52.3 -3.5 Contracting From Growing 1 Production 53.5 52.2 +1.3 Contracting From Growing 1 Employment 50.1 50.2 -0.1 Growing Slower 44 Supplier Deliveries 48.7 50.9 -2.2 Faster From Slowing 1 Inventories 49.0 46.5 +2.5 Contracting Slower 3 Customers' Inventories 46.0 44.5 +1.5 Too Low Slower 18 Prices 49.5 50.0 -0.5 Decreasing From Unchanged 1 Backlog of Orders 48.0 53.0 -5.0 Contracting From Growing 1 Exports 51.0 54.0 -3.0 Growing Slower 6 Imports 54.5 55.0 -0.5 Growing Slower 4 SynopsisLast month I stated "Manufacturing employment has grown for 43 months. I expect that trend to break next month. Production was up but inventories were way lower. The drop in inventories, in conjunction with a big slowdown in employment, is likely a leading indicator of future production. The positive surprise that does not fit into the above assessment is that new orders grew at a faster rate. Next month may be telling. I expect the new order divergence to resolve to the downside as the global economy and the US economy are both slowing." The consensus estimate was for slower growth, but here we are. Manufacturing is in contraction and the economy continues to weaken. Given the plunge in new orders and backlog of orders, jobs and the overall economy will likely weaken as well. Expect that trend of 48 months of economic growth to break next month. globaleconomicanalysis.blogspot.com/2013/06/huge-miss-in-may-ism-what-numbers-mean.html================================ June 03, 2013 ISM Manufacturing index declines in May to 49.0, Lowest since June 2009 by Bill McBride on 6/03/2013 The ISM manufacturing index indicated contraction in May. The PMI was at 49.0% in May, down from 50.7% in April. The employment index was at 50.1%, down from 50.2%, and the new orders index was at 48.8%, down from 52.3% in April. From the Institute for Supply Management: May 2013 Manufacturing ISM Report On Business Economic activity in the manufacturing sector contracted in May for the first time since November 2012, and the overall economy grew for the 48th consecutive month, say the nation's supply executives in the latest Manufacturing ISM Report On Business.
The report was issued today by Bradley J. Holcomb, CPSM, CPSD, chair of the Institute for Supply Management™ Manufacturing Business Survey Committee. "The PMI™ registered 49 percent, a decrease of 1.7 percentage points from April's reading of 50.7 percent, indicating contraction in manufacturing for the first time since November 2012 and only the second time since July 2009. This month's PMI™ reading is at its lowest level since June 2009, when it registered 45.8 percent. The New Orders Index decreased in May by 3.5 percentage points to 48.8 percent, and the Production Index decreased by 4.9 percentage points to 48.6 percent. The Employment Index registered 50.1 percent, a slight decrease of 0.1 percentage point compared to April's reading of 50.2 percent. The Prices Index registered 49.5 percent, decreasing 0.5 percentage point from April, indicating that overall raw materials prices decreased from last month. Several comments from the panel indicate a flattening or softening in demand due to a sluggish economy, both domestically and globally." 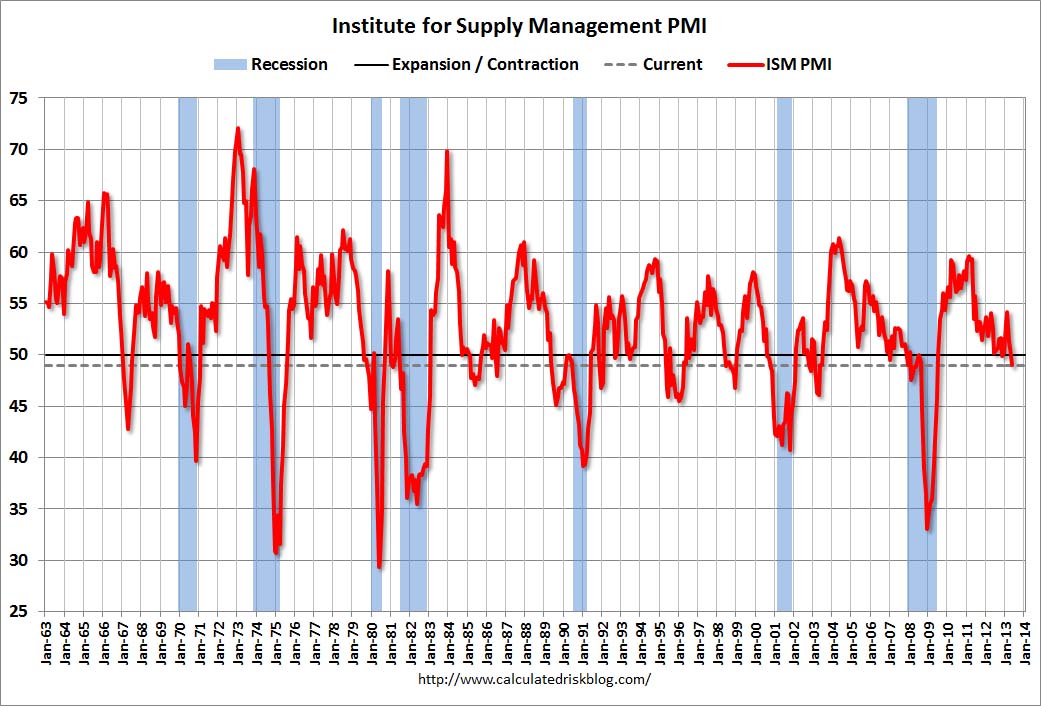 2.bp.blogspot.com/-iy8_4F18Jlc/Uayh_frHUJI/AAAAAAAAaiQ/KNFe3zYjphY/s1600/ISMMay2013.jpg 2.bp.blogspot.com/-iy8_4F18Jlc/Uayh_frHUJI/AAAAAAAAaiQ/KNFe3zYjphY/s1600/ISMMay2013.jpg Here is a long term graph of the ISM manufacturing index. This was below expectations of 51.0% and suggests manufacturing contracted in May for the first time since November 2012. www.calculatedriskblog.com/2013/06/ism-manufacturing-index-declines-in-may.html======================================== June 3, 2013 ISM manufacturing gauge worst in four yearsBiggest contraction in four years as new orders, production shrink Stories You Might Like WASHINGTON (MarketWatch) — Executives at American manufacturing companies reported sharply lower orders in May and the biggest contraction in their business in almost four years, according to a closely followed survey. The Institute for Supply Management index fell to 49.0% last month from 50.7% in April, well below the MarketWatch forecast of 51.0%. Any number below 50% signals that business is shrinking instead of growing. The ISM index is compiled from a survey of executives who order raw materials and other supplies for their companies. The gauge tends to rise or fall in tandem with the health of the economy. After heavy losses during the Great Recession, manufacturers rode a strong performance in 2010 and 2011 before momentum waned in 2012. A slower U.S. expansion and more economic turmoil in key export markets has hindered American manufacturers and restrained their growth. “Several comments from the panel indicate a flattening or softening in demand due to a sluggish economy, both domestically and globally,” said Bradley Holcomb, chairman of the ISM survey committee. In U.S. markets on Monday, stocks SPX -0.06% extended gains despite the surprising decline in the ISM index. Markets have been concerned about when the Federal Reserve will start reducing the rate of bond purchases, so news on the economy that is soft can sometimes be received positively by traders. The ISM’s new-orders gauge fell to 48.8% from 52.3% in April and hit the lowest level since July 2012. The production index slumped to 48.6% from 53.4%, the lowest reading since May 2009. Yet the employment gauge, a measure of hiring intentions, only fell a tick to 50.1% from 50.2%. Ten of the 18 U.S. manufacturing industries surveyed by ISM reported growth in May. A similar report from Markit released Monday saw a slight improvement in May, to a 52.3 reading from 52.1 in April. That’s just above a six-month low www.marketwatch.com/story/ism-manufacturing-gauge-worst-in-four-years-2013-06-03?dist=lcountdown
|
|
|
|
Post by jeffolie on Jun 3, 2013 20:12:28 GMT -6
June 03, 2013 U.S. Light Vehicle Sales increased to 15.3 million annual rate in May by Bill McBride on 6/03/2013 Based on an estimate from AutoData Corp, light vehicle sales were at a 15.31 million SAAR in May. That is up 10% from May 2012, and up 3% from the sales rate last month. This was slightly above the consensus forecast of 15.2 million SAAR (seasonally adjusted annual rate). This graph shows the historical light vehicle sales from the BEA (blue) and an estimate for May (red, light vehicle sales of 15.31 million SAAR from AutoData).  3.bp.blogspot.com/-9UVi7947vZo/Uazo67UG94I/AAAAAAAAai4/FsBByXZdof4/s1600/VehicleSalesMay2013.jpg 3.bp.blogspot.com/-9UVi7947vZo/Uazo67UG94I/AAAAAAAAai4/FsBByXZdof4/s1600/VehicleSalesMay2013.jpgThis was the near the post-recession high for auto sales. After three consecutive years of double digit auto sales growth, the growth rate will probably slow in 2013 - but this will still be another positive year for the auto industry even if sales move mostly sideways for the rest of 2013. 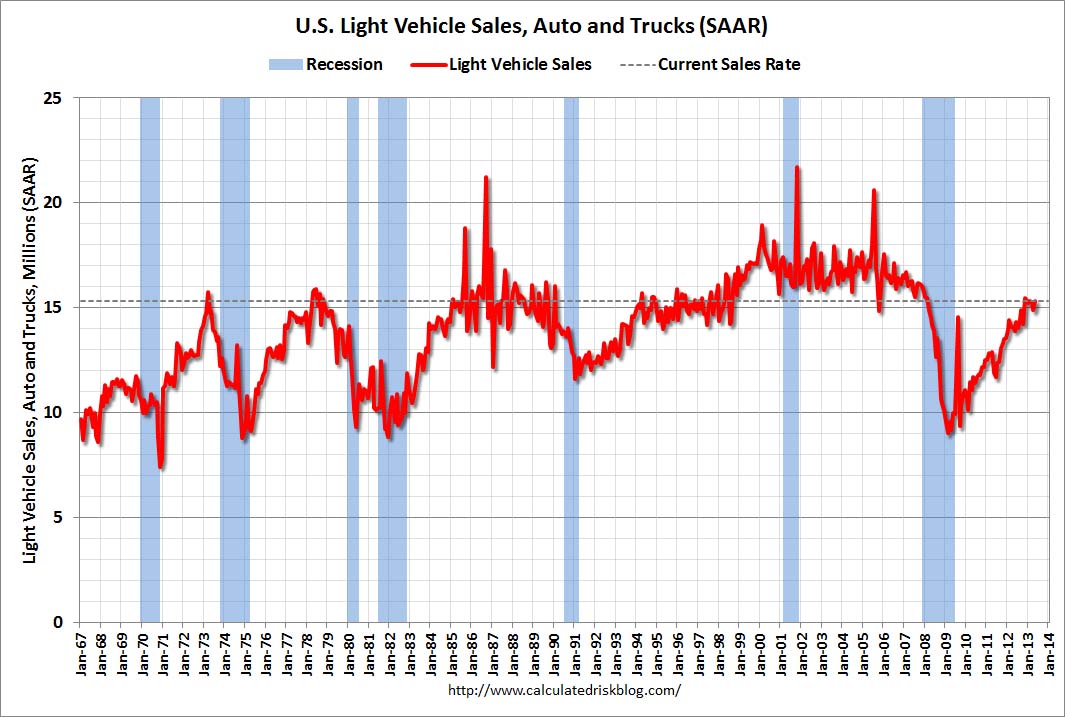 4.bp.blogspot.com/-VOfcOVWG_GM/Uazo90zAMNI/AAAAAAAAajA/ZeO8EE2r0kU/s1600/VehicleSalesLongMay2013.jpg 4.bp.blogspot.com/-VOfcOVWG_GM/Uazo90zAMNI/AAAAAAAAajA/ZeO8EE2r0kU/s1600/VehicleSalesLongMay2013.jpgThe second graph shows light vehicle sales since the BEA started keeping data in 1967. Note: dashed line is current estimated sales rate. Unlike residential investment, auto sales bounced back fairly quickly following the recession and had been a key driver of the recovery. Looking forward, growth will slow for auto sales. If sales average the recent pace for the entire year, total sales will be up about 5% from 2012. www.calculatedriskblog.com/2013/06/us-light-vehicle-sales-increased-to-153.html |
|
|
|
Post by unlawflcombatnt on Jun 3, 2013 21:56:27 GMT -6
The main story was that New Orders decreased a whopping -3.5%.
That means new workers won't be hired, leading to further declines in worker income and buying power--which would logically lead to even further declines in demand for goods.
|
|
|
|
Post by jeffolie on Jun 4, 2013 6:51:51 GMT -6
June 4, 2013, 8:30 a.m. EDT U.S. trade deficit climbs 8.5% in (MarketWatch) - The U.S. trade deficit climbed 8.5% to $40.3 billion in April from a revised $37.1 billion in the prior month, as imports from China surged after the end of a major holiday season in that country. Economists surveyed by MarketWatch forecast the deficit to climb to a seasonally adjusted $41.5 billion from an initial estimate of $38.8 billion in March. In April, U.S. exports rose 1.2% to a seasonally adjusted $187.4 billion, while imports increased 2.4% to $227.7 billion, the Commerce Department said Tuesday. The trade gap with China, which fell to the lowest level in March in three years, jumped to $24.1 billion from $17.9 billion. Deficits with the European Union, the OPEC oil producing countries and Japan also rose. The trade deficit related to petroleum fell for the third straight month, however www.marketwatch.com/story/us-trade-deficit-climbs-85-in-april-2013-06-04?dist=beforebell====================================================================================== Tuesday, June 04, 2013 Trade Deficit increased in April to $40.3 Billion by Bill McBride on 6/04/2013 The Department of Commerce reported: [T]otal April exports of $187.4 billion and imports of $227.7 billion resulted in a goods and services deficit of $40.3 billion, up from $37.1 billion in March, revised. April exports were $2.2 billion more than March exports of $185.2 billion. April imports were $5.4 billion more than March imports of $222.3 billion.. The trade deficit was lower than the consensus forecast of $41.2 billion. The first graph shows the monthly U.S. exports and imports in dollars through April 2013.  2.bp.blogspot.com/-rhaixr1rVi4/Ua3fqkK8_fI/AAAAAAAAajc/butNYdRizeE/s1600/TradeApr2013.jpg 2.bp.blogspot.com/-rhaixr1rVi4/Ua3fqkK8_fI/AAAAAAAAajc/butNYdRizeE/s1600/TradeApr2013.jpgBoth exports and imports increased in April. Imports rebounded from the decline in March that was partially due to the timing of the Chinese New Year. Exports are 13% above the pre-recession peak and up 2% compared to April 2012; imports are 2% below the pre-recession peak, and down 1% compared to April 2012 (mostly moving sideways). 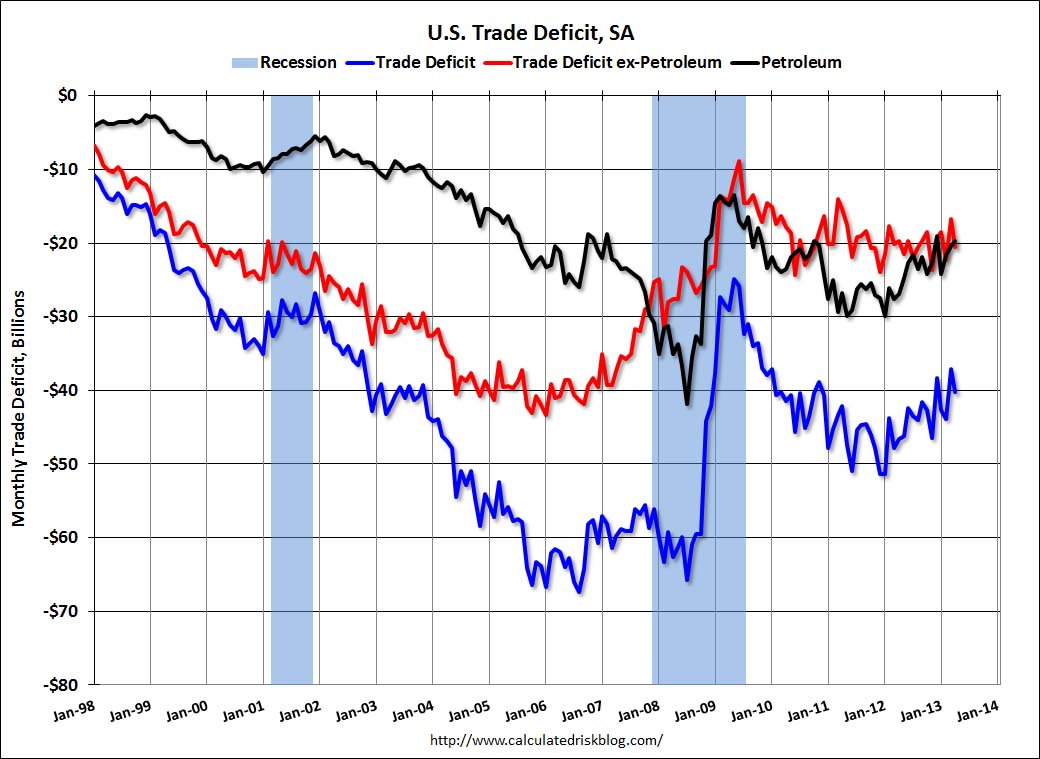 4.bp.blogspot.com/-cCkfuA6-bLQ/Ua3fs9nSHYI/AAAAAAAAajk/a7FcbiNGkLE/s1600/TradeDeficitApr2013.jpg 4.bp.blogspot.com/-cCkfuA6-bLQ/Ua3fs9nSHYI/AAAAAAAAajk/a7FcbiNGkLE/s1600/TradeDeficitApr2013.jpgThe second graph shows the U.S. trade deficit, with and without petroleum, through April. The blue line is the total deficit, and the black line is the petroleum deficit, and the red line is the trade deficit ex-petroleum products. Most of the recent improvement in the trade deficit is related to petroleum. Oil averaged $97.82 in April, up from $96.95 per barrel in March, but down from $109.69 in April 2012. Oil import prices should decline in May. The trade deficit with the euro area was $10.0 billion in April, up from $7.8 billion in April 2012. The trade deficit with China decreased to $24.1 billion in April, down from $24.5 billion in April 2012. Most of the trade deficit is related to China . Read more at www.calculatedriskblog.com/2013/06/trade-deficit-increased-in-april-to-403.html#pZxv9fc5SOCfeTkh.99==================================================================== US April Trade Deficit Rises But Less Than Expected 06/04/2013 Following April's surprising drop in crude imports which led to a multi-year low in the March trade balance (revised to -$37.1 billion), the just released April data showed an 8.5% jump in the deficit to $40.3 billion, if modestly better than the expected $41.1 billion. This was driven by a $2.2 billion increase in exports to $185.2 billion offset by a more than double sequential jump in imports by $5.4 billion, to $222.3 billion. More than all of the change was driven by a $3.2 billion increase in the goods deficit, offset by a $0.1 billion surplus in services.The Census Bureau also revised the entire historical data series, the result of which was a drop in the March deficit from $38.8 billion to $37.1 billion. In April 233,215K barrels of oil were imported, well above the 215,734K in March, and the highest since January. Furthermore, since the Q1 cumulative trade deficit has been revised from $126.9 billion to $123.7 billion, expect higher Q1 GDP revisions, offset by even more tapering of Q2 GDP tracking forecasts. And since the data is hardly as horrible as yesterday's ISM, we don't think it will be enough on its own to guarantee the 21 out of 21 Tuesday track record, so we eagerly look forward to today's POMO as the catalyst that seals the deal. www.zerohedge.com/sites/default/files/images/user5/imageroot/2013/06/Deficit%20April.jpg www.zerohedge.com/sites/default/files/images/user5/imageroot/2013/06/Deficit%20April.jpg www.zerohedge.com/sites/default/files/images/user5/imageroot/2013/06/Trade%20April.jpg www.zerohedge.com/sites/default/files/images/user5/imageroot/2013/06/Trade%20April.jpgBreaking down the export goods balance, the deficit reflected increases in consumer goods ($2.0 billion); capital goods ($0.9 billion); and automotive vehicles, parts, and engines ($0.6 billion). Decreases occurred in industrial supplies and materials ($0.9 billion); other goods ($0.5 billion); and foods, feeds, and beverages ($0.3 billion). On the import side, The March to April increase in imports of goods reflected increases in consumer goods ($3.0 billion); automotive vehicles, parts, and engines ($1.3 billion); capital goods ($1.0 billion); and other goods ($0.2 billion). Decreases occurred in industrial supplies and materials ($0.3 billion) and foods, feeds, and beverages ($0.1 billion). Exports of services increased $0.4 billion from March to April. The increase was more than accounted for by increases in other private services ($0.2 billion), which includes items such as business, professional, and technical services, insurance services, and financial services, in travel ($0.1 billion), and in other transportation ($0.1 billion), which includes freight and port services. A decrease in passenger fares ($0.1 billion) partly offset these increases. Broken down by country we find the biggest trade surplus with Hong Kong $2.4 ($3.2 for March), Australia $1.1 ($1.5), Singapore $0.8 ($1.4), and Brazil $1.2 ($1.7). Deficits were recorded with China $24.1 ($17.9), the European Union $12.4 ($9.9), Japan $6.9 ($6.6), OPEC $6.6 ($4.5), Germany $6.1 ($5.1), Mexico $4.4 ($5.3), Saudi Arabia $2.6 ($2.1), Canada $2.4 ($2.3), India $2.4 ($1.8), Ireland $2.4 ($2.1), Korea $2.4 ($1.3), and Venezuela $1.5 ($1.3). www.zerohedge.com/news/2013-06-04/us-april-trade-deficit-rises-less-expected |
|
|
|
Post by jeffolie on Jun 5, 2013 6:59:59 GMT -6
June 05, 2013 Fed's Beige Book: Economic activity "increased at a modest to moderate pace" by Bill McBride on 6/05/2013 Fed's Beige Book "Prepared at the Federal Reserve Bank of Minneapolis and based on information collected on or before May 24, 2013." Overall economic activity increased at a modest to moderate pace since the previous report across all Federal Reserve Districts except the Dallas District, which reported strong economic growth. The manufacturing sector expanded in most Districts since the previous Beige Book. Most Districts noted slight to moderate gains in consumer spending and a moderate increase in vehicle sales. Tourism showed signs of strength in several Districts. A wide variety of business services expanded, and transportation traffic increased for producer, consumer, and trade goods. Residential real estate and construction activity increased at a moderate to strong pace in all Districts. Commercial real estate and construction activity grew at a modest to moderate pace in most Districts. Overall bank lending increased since the previous report. And on real estate: Residential real estate and construction activity increased at a moderate to strong pace in all Districts. Several Districts reported that higher demand and low inventory of homes available for sale are resulting in multiple offers on properties. Almost all Districts reported higher home sale prices. The Kansas City District reported concerns that appraisals were not keeping pace with price increases. Foreclosed properties available for sale have declined significantly in the San Francisco District. The rental market remains tight with noticeable increases in rental rates in the New York District. Residential construction increased across all of the reporting Districts. ... Commercial real estate and construction activity expanded at a modest to moderate pace in most Districts. The New York District reported that the Manhattan market is particularly robust. The Chicago District noted that an increase in demand for leasing was pushing up commercial rents, with strong demand from the health care sector. However, a market in the Boston District indicated no change in commercial rents or vacancy rates since the previous report. Residential real estate continues to be a strong sector for the economy. Overall this was a slight downgrade from the previous beige book ( downgrade from "moderate" growth to "modest to moderate"). Read more at www.calculatedriskblog.com/2013/06/feds-beige-book-economic-activity.html#bmiy5DOjURfHWvYE.99 ================================================== (MarketWatch) - Orders for goods produced in U.S. factories rose 1.0% in April, largely because of higher demand for autos and airplanes, the Commerce Department reported Wednesday. Economists surveyed by MarketWatch expected orders to rise by 1.6%. Excluding transportation, orders fell 0.1%, however. Orders for durable goods - products meant to last at least three years - climbed 3.5% in April. Orders for nondurable goods such as food and clothing dropped 1.0%. In March, factory orders were revised slightly to show a 4.7% decrease instead of 4.9% as initally reported. Shipments of all factory goods in April fell 0.7%. www.marketwatch.com/story/us-factory-orders-increase-10-in-april-2013-06-05?link=MW_home_latest_news===================================================  1.bp.blogspot.com/-LL9wUcZcL6o/Ua9FSgyZpTI/AAAAAAAAalg/BRLdS-wLVbU/s1600/ISMServiceMay2013.jpg 1.bp.blogspot.com/-LL9wUcZcL6o/Ua9FSgyZpTI/AAAAAAAAalg/BRLdS-wLVbU/s1600/ISMServiceMay2013.jpgWASHINGTON (MarketWatch) -- The Institute for Supply Management said its May services index edged up to 53.7% in May from 53.1% in April, indicating a slight acceleration. Economists polled by MarketWatch had expected a 54.0% reading. Of the key subindexes, the business activity index was at 56.5%, the new orders index was at 56%, and employment barely stayed positive at 50.1% www.marketwatch.com/story/ism-services-index-sees-slight-acceleration-in-may-2013-06-05====================================================== U.S. labor costs decline at fastest pace since 1947 • U.S. economy adds 135,000 private-sector jobs in May www.marketwatch.com/==================================================== futures traded modestly lower on Wednesday as data found that U.S. private-sector job growth in May and first-quarter productivity came in below expectations. U.S. companies created 135,000 jobs in May, according to ADP Employer Services. Revised government figures had productivity rising 0.5% in the January-to-March period, and hourly compensation falling 3.8%. THE REST OF THE STORY: MARKET SNAPSHOT Today's stock-market coverage continues in Market Snapshot/conga/story/misc/indy_snap.html 231096 The data, which come ahead of Friday’s monthly nonfarm-payrolls report, added credence to the view that a soft labor market would extend the time frame before the Federal Reserve begins tapering its $85 billion in monthly bond purchases. Off nearly 60 points ahead of the reports, futures for the Dow industrials DJM3 -0.32% were lately down 48 points to 15,131, while those for the Standard & Poor’s 500 index SPM3 -0.31% declined 5.8 points to 1,625.40. Futures for the Nasdaq 100 index NDM3 -0.32% lost 10 points to 2,964.75. The Institute for Supply Management will release its May survey of purchasing managers in the services industry at 10 a.m. Eastern. Economists polled by MarketWatch expect an improvement to 54.0% from 53.1% in April. “U.S. ISM non-manufacturing will be followed closely, given the surprise drop in the manufacturing ISM,” said analysts at Danske Bank in a note. “We expect an improvement, which if confirmed would support the thesis that the weakness in the manufacturing ISM was externally driven rather than reflecting softer domestic demand.” Also at 10 a.m. Eastern, the Commerce Department is expected to report that factory orders in April rose 1.6% compared to a 4.9% fall the prior month. At 2 p.m. Eastern, the Fed’s Beige Book of anecdotes about the economy, which is prepared ahead of an interest-rate decision, will be released. The last Beige Book said the U.S. economy expanded at a “moderate” pace. A 20-session-long Tuesday win streak for the Dow industrials ( DJIA -0.50% was derailed, with the index falling 76.49 points, or 0.5%, to end at 15,177.54. Fears over when the Federal Reserve will begin to pull back on its bond-buying program weighed on sentiment. On Tuesday, Fed Bank of Kansas City President Esther George advocated for the Fed to pare back its bond-buying program, and Dallas Fed President Richard Fisher stepped up his criticism of the Fed’s easy-money program. Strategists at Credit Suisse said Wednesday that they see 15% more upside for stocks. They lifted their Standard & Poor’s 500 index SPX -0.55% year-end target to 1,730 from 1,640 and introduced a new target of 1,900 for the end of 2014. The Credit Suisse strategists gave five reasons for staying overweight in equities, including an overly pessimistic view on when the Fed will curb its bond-buying program. Read more on Credit Suisse's equity call Asian markets had a chaotic session, with the Nikkei Stock Average JP:NIK -3.26% sinking 3.8% after Prime Minister Shinzo Abe’s blueprint to spur long-term growth for the country disappointed the markets. European stocks followed suit, though losses were less dramatic. The dollar USDJPY -0.46% climbed as high as ¥100.45 before sliding back as Japan’s prime minister began speaking. The dollar was last trading around ¥99.615. Gold was trading mildly higher, as were oil prices www.marketwatch.com/story/stock-futures-off-ahead-of-adp-beige-book-2013-06-05 |
|
|
|
Post by jeffolie on Jun 6, 2013 8:03:05 GMT -6
Jobless claims: Less firing, but where's the hiring? June 6, 2013 NEW YORK (CNNMoney) Fewer Americans filed first-time claims for unemployment benefits last week, pointing to more slow and choppy improvement in the job market. About 346,0000 people filed initial jobless claims last week, 11,000 fewer than a week earlier, the Department of Labor said. Jobless claims are a volatile indicator from week to week, but nevertheless are considered a key measure of layoffs. Economists often prefer to look at a four-week moving average, to smooth out some of the choppiness, and that measure rose slightly last week. Some turnover is normal in the job market. In early 2007, before the recession began, it was common to see about 315,000 initial claims filed each week. At the height of the jobs crisis in 2009, weekly claims surged as high as 670,000. So far in 2013, claims are hovering around their lowest levels since 2008 -- a welcome sign that firms are firing fewer workers these days. But this question still remains -- when will businesses start hiring more new workers? The Labor Department plans to release its key monthly jobs report on Friday morning, and economists surveyed by CNNMoney expect that report to show 158,000 jobs were created in May. Job growth at that level is hardly remarkable. It barely keeps up with population growth. And considering the economy added an average of 173,000 jobs each month over the last year, it would point to a slight slowdown in hiring recently. Related: Employment is still near a 30-year low Overall, about 11.7 million people still remain unemployed as of April, but not all of them are collecting benefits. The latest initial claims report shows 2.95 million people filed for their second week or more of unemployment benefits in the week ending May 25, the most recent data available. That marks a decline from 3 million a week earlier. money.cnn.com/2013/06/06/news/economy/unemployment-benefits/
|
|
|
|
Post by jeffolie on Jun 7, 2013 10:00:27 GMT -6
June 07, 2013 Employment Report Comments and more Graphs by Bill McBride on 6/07/2013 Total nonfarm employment is up 2.115 million over the 12 months, and up 946 thousand so far in 2013 (a 2.27 million annual pace). Private employment is up 2.173 million over the last year, and up 972 thousand so far in 2013 (a 2.33 million annual pace). Of course public payrolls are continuing to shrink (four years of declining public payrolls now). Public employment is down 58 thousand over the last year, and down 26 thousand so far in 2013 (a 62 thousand annual pace). And on construction employment: Construction employment is up 189 thousand over the last year, and up 93 thousand so far in 2013 (a 223 thousand annual pace). A few more graphs ... Employment-Population Ratio, 25 to 54 years old 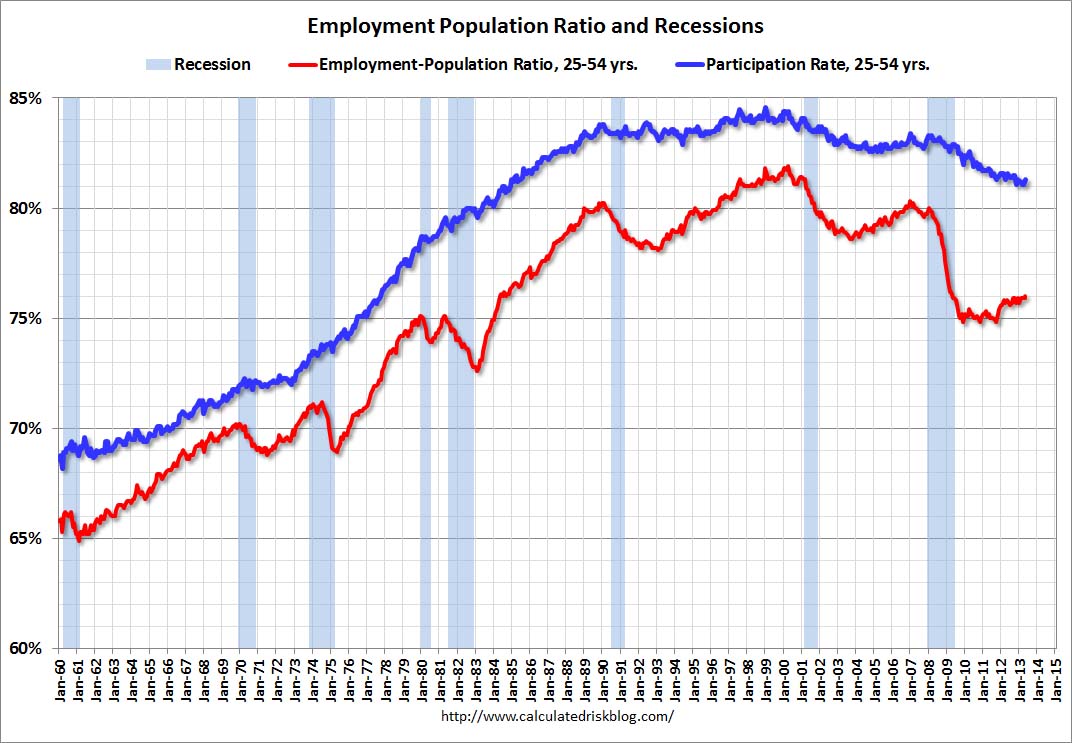 3.bp.blogspot.com/-CYKrvw3-_zg/UbHqY66HRoI/AAAAAAAAang/AjXIyCjp9Fs/s1600/EmployPop2554May2013.jpg 3.bp.blogspot.com/-CYKrvw3-_zg/UbHqY66HRoI/AAAAAAAAang/AjXIyCjp9Fs/s1600/EmployPop2554May2013.jpg Since the participation rate declined recently due to cyclical (recession) and demographic (aging population) reasons, an important graph is the employment-population ratio for the key working age group: 25 to 54 years old. In the earlier period the employment-population ratio for this group was trending up as women joined the labor force. The ratio has been mostly moving sideways since the early '90s, with ups and downs related to the business cycle. This ratio should probably move close to 80% as the economy recovers. The ratio increased to 76.0% in May, the highest since April 2009. The participation rate for this group also increased in May to 81.3%. The decline in the participation rate for this age group is probably mostly due to economic weakness, whereas most of the decline in the overall participation rate is probably due to demographics.  1.bp.blogspot.com/-Z6f4mlCUpSQ/UbHqb-GrE7I/AAAAAAAAano/3xcd4KkFjO8/s1600/EmployRecAlignMay2013.jpg 1.bp.blogspot.com/-Z6f4mlCUpSQ/UbHqb-GrE7I/AAAAAAAAano/3xcd4KkFjO8/s1600/EmployRecAlignMay2013.jpgPercent Job Losses During Recessions This graph shows the job losses from the start of the employment recession, in percentage terms - this time aligned at maximum job losses. In the earlier post, the graph showed the job losses aligned at the start of the employment recession. This financial crisis recession was much deeper than other post WWII recessions, and the recovery has been slower (the recovery from the 2001 recession was slow too). However, if we compare to other financial crisis recoveries, this recovery has actually been better than most. 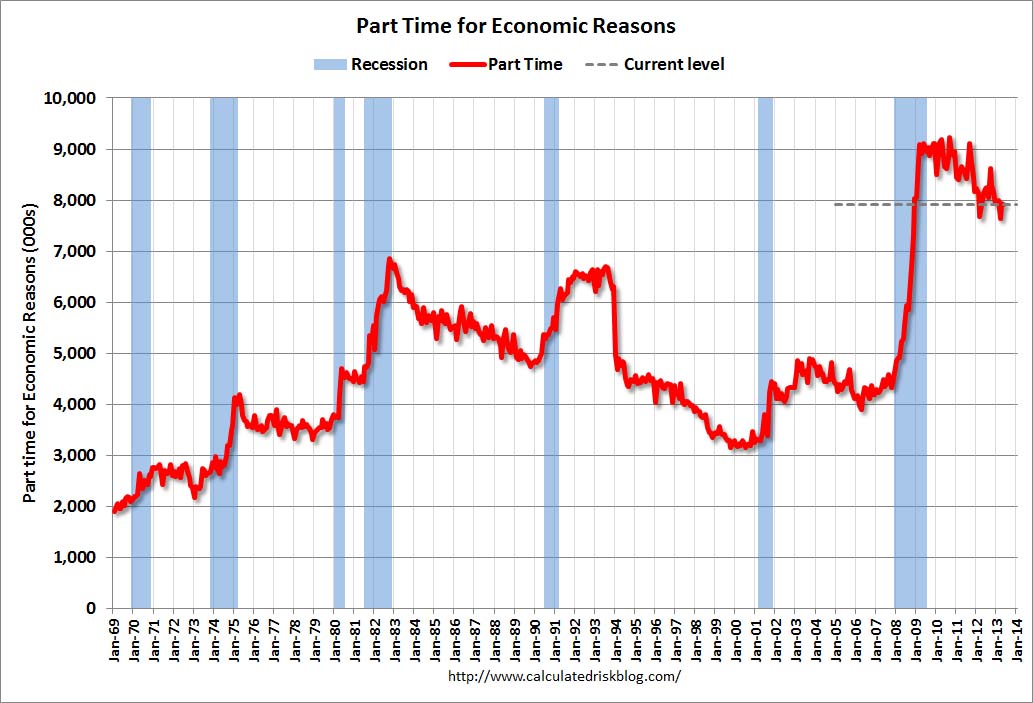 4.bp.blogspot.com/-yyBxrrYK6DE/UbHqfqRyErI/AAAAAAAAanw/FPmZsy5Esew/s1600/PartTimeMay2013.jpg 4.bp.blogspot.com/-yyBxrrYK6DE/UbHqfqRyErI/AAAAAAAAanw/FPmZsy5Esew/s1600/PartTimeMay2013.jpgPart Time for Economic Reasons From the BLS report: In May, the number of persons employed part time for economic reasons (sometimes referred to as involuntary part-time workers) was unchanged at 7.9 million. These individuals were working part time because their hours had been cut back or because they were unable to find a full-time job. The number of part time workers decreased slightly in May to 7.904 million. These workers are included in the alternate measure of labor underutilization (U-6) that decreased slightly to 13.8% in May. This matches the lowest level for U-6 since December 2008. 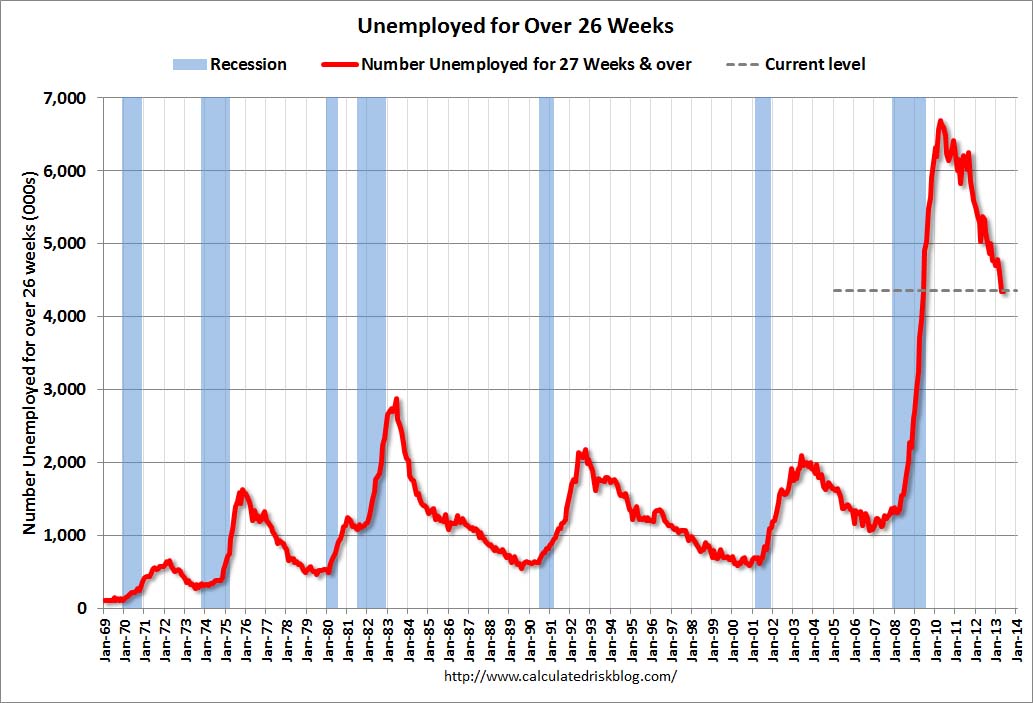 3.bp.blogspot.com/-RyuZKKkZRrQ/UbHqjLz0-YI/AAAAAAAAan4/UBoojF3cRV4/s1600/Unemploy26May2013.jpg 3.bp.blogspot.com/-RyuZKKkZRrQ/UbHqjLz0-YI/AAAAAAAAan4/UBoojF3cRV4/s1600/Unemploy26May2013.jpg Unemployed over 26 Weeks This graph shows the number of workers unemployed for 27 weeks or more. According to the BLS, there are 4.357 million workers who have been unemployed for more than 26 weeks and still want a job. This was slightly from from 4.353 million in April. This is trending down, but is still very high. Long term unemployment remains one of the key labor problems in the US. 3.bp.blogspot.com/-RyuZKKkZRrQ/UbHqjLz0-YI/AAAAAAAAan4/UBoojF3cRV4/s1600/Unemploy26May2013.jpg State and Local Government This graph shows total state and government payroll employment since January 2007. State and local governments lost jobs for four straight years. (Note: Scale doesn't start at zero to better show the change.) In May 2013, state and local governments added 11,000 jobs, and state and local employment is up 25 thousand so far in 2013. I think most of the state and local government layoffs are over. Of course total public employment declined again as the Federal government layoffs are ongoing - and with many more layoffs expected due to the sequestration spending cuts. In 2013, construction is a bright spot for employment, the drag from state and local cutbacks is mostly over - and Federal fiscal cutbacks are an ongoing drag. Pretty much as expected. www.calculatedriskblog.com/2013/06/employment-report-comments-and-more.html |
|
|
|
Post by jeffolie on Jun 7, 2013 10:42:19 GMT -6
bart's blog: Update 6/7/2013 - Unemployment: U3 up to 7.6% from 7.5%, U6 down to 13.8% from 13.9%, U7 up to 21.5% from 20.9%. Non farm payroll, +175k. Birth/death mode, +205k. Unemployment mean duration up to 36.9 weeks from 36.5 weeks. Participation rate unusually up to 63.4% from 63.3%. Employed, usually work part time, +150k. Household survey, +319k employed. Part time for economic reasons, could only find part time work +194k. Self employed -33k. Overall, not a bad report. blog.nowandfutures.com/index.html |
|
|
|
Post by jeffolie on Jun 7, 2013 10:45:46 GMT -6
Hours and Wages Private average weekly hours were flat at 34.4 hours. Average hourly earnings of all private workers rose $0.01 to $23.89. Average hourly earnings of private-sector production and nonsupervisory employees was also up $0.01 to $20.08. Real wages have been declining. Add in increases in state taxes and the average Joe has been hammered pretty badly. For 2013, one needs to factor in the increase in payroll taxes for Social Security Read more at globaleconomicanalysis.blogspot.com/#I1Iq10RKfmvlpoAi.99 |
|
|
|
Post by jeffolie on Jun 7, 2013 19:07:24 GMT -6
Economic Releases & Statistics
The US trade deficit widened less than anticipated in April – up from $37.1 billion to $40.3 billion compared to forecasts of a rise to $41.0 billion. Exports rose 1.2 percent to $187.4 billion – marking its second highest on record – while imports soared 2.4 percent to $227.7 billion. (4) The ISM’s US manufacturing index unexpectedly contracted in May – falling from an April reading of 50.7 to 49 versus forecasts for a rise to 51. The decline brought the index to nearly a 4-year low, as new orders dropped to an almost 1-year low of 48.6 percent. (5) However, the Institute’s services index expanded in May – rising from an April reading of 53.1 to 53.7 – as new orders rose from 54.5 to 56. Economists were looking for a slightly higher increase to 53.8. (6) The US unemployment rate rose from 7.5 percent to 7.6 percent in May, as more people made an effort to head back into the workforce. (7) Euro-Zone’s producer price index made a surprise downturn in April – declining 0.2 percent annually on a 2 percent price decline in the energy sector and a 0.3 percent fall in intermediate goods prices. Economists had expected prices to rise 2 percent. (8) As expected, the Euro-Zone’s 1Q gross domestic product contracted 0.2 percent for a year-on-year contraction of 1.1 percent. The contraction was slower than the previous quarter’s 0.6 percent decline as inventories and household demand stabilized. (9)
|
|
|
|
Post by jeffolie on Jun 7, 2013 19:14:23 GMT -6
GOLDILOCKS: This Was The Perfect Jobs Report For The Market Jun. 7, 2013 The jobs report for May just came out. Job creation was solid at 175K. That's ahead of the 163K that we got last month. And yet the unemployment rate rose to 7.6%. The previous month was 7.5%. That's partially because the labor force participation rate actually increased. This is great news for the market. You get solid job creation, meaning the economy is on track, and yet there's no tightening in unemployment, which would force the Fed's hand on quickly tapering QE.
Futures are jumping. Read more: www.businessinsider.com/goldilocks-this-was-the-perfect-jobs-report-for-the-market-2013-6#ixzz2VaBvoDbN
|
|
|
|
Post by jeffolie on Jun 8, 2013 13:06:06 GMT -6
Consumer Credit in U.S. Climbed in April on Non-Revolving Loans jun 7, 2013 Consumer borrowing in the U.S. accelerated in April as Americans took out more education and automobile loans. The $11.1 billion increase in credit followed a revised $8.37 billion increase the previous month that was more than initially reported, Federal Reserve figures showed today in Washington. The median forecast in a Bloomberg survey called for a $12.9 billion gain in April. Credit-card use rose as Americans contended with higher payroll taxes and limited income growth. Higher stock and property values are putting households in a position to take advantage of low interest rates for bigger purchases, such as cars. Credit-card use also rose as Americans contended with higher payroll taxes and limited income growth. “A lot of what is driving consumer credit right now is non-revolving credit,” Tom Simons, an economist for Jefferies LLC in New York, said before the report. Simons is the second-best forecast of consumer credit over the past two years, according to data compiled by Bloomberg. “The unemployment rate is going to have to fall and earnings are going to have to go up before people are comfortable spending more than they make.” A Labor Department report earlier today showed wage gains aren’t picking up. Average hourly earnings were little changed at $23.89 in May after $23.88 in the prior month. They were up 2 percent in 12 months ended in May, the same as in April. Employers last month increased payrolls by a net 175,000 after a revised 149,000 gain in April that was smaller than first estimated. The unemployment rate rose to 7.6 percent from 7.5 percent as more people entered the labor force. Estimates of the 32 economists surveyed by Bloomberg for consumer credit ranged from gains of $8.5 billion to $17.5 billion. Non-Revolving Loans Non-revolving debt, such as that for college tuition and the purchase of vehicles and mobile homes, increased $10.4 billion, today’s report showed. Lending to consumers by the federal government, which is mainly for student loans, rose by $1.5 billion before adjusting for seasonal variations. Automobile demand has been a bright spot for the economy. Cars and light trucks sold at an average 15.26 million annualized rate in the first quarter, the strongest since the same period in 2008, according to data from Ward’s Automotive Group. In May, vehicles sold at a 15.24 million pace. Revolving debt, which includes credit cards, increased by $682.3 million after a $906.4 million decrease. Personal spending in April fell 0.2 percent after a 0.1 percent gain in the prior month, the Commerce Department said on May 31. Incomes were unchanged following a 0.3 percent advance. Housing Gains Consumer spending, which accounts for about 70 percent of the economy, is also being underpinned by the recovery in housing. The S&P/Case-Shiller index of property values in 20 cities increased 10.9 percent in the year to March, the biggest 12-month gain since April 2006, a report showed last month. The Fed’s consumer credit report doesn’t track debt secured by real estate, such as home-equity lines of credit and home mortgages. Higher stock prices also provide the wherewithal to increase spending. The U.S. is in the fifth year of a bull market amid better-than-estimated corporate earnings and three rounds of bond purchases by the Fed. The Standard & Poor’s 500 index increased 13.8 percent this year through yesterday. www.bloomberg.com/news/2013-06-07/consumer-credit-in-u-s-climbed-in-april-on-non-revolving-loans.html=========================================================================== 2013-06-07 by Karl Denninger Consumer Credit: Meh From the Federal Screwserve:  market-ticker.org/akcs-www?get_gallerynr=4236 market-ticker.org/akcs-www?get_gallerynr=4236In April, consumer credit increased at a seasonally adjusted annual rate of 4-3/4 percent. Revolving credit increased at an annual rate of 1 percent, while nonrevolving credit increased at an annual rate of 6-1/2 percent. Uh huh. You know my view -- I use unadjusted numbers, and look at both rate of change and the raw figures. So let's do it.  market-ticker.org/akcs-www?get_gallerynr=4235 market-ticker.org/akcs-www?get_gallerynr=4235Revolving continues to bounce around zero; of interest is that non-revolving is starting to curl over on the rate of increase. What do levels tell us? Well, most of it was autos in the non-revolving area, basically. Student loans only went up $1.425 billion (out of close to $10 billion total), but this is to be expected as this isn't exactly a month where people enter college, right? Revolving was up slightly -- $2.5 billion, but paid down some $38 billion from Christmas. Balances should, if trends hold, start rising shortly (like in next month's report.) Here's an interesting and somewhat-disturbing fact though -- last year at this same time consumers managed to pay off $44.6 billion from Christmas. That additional carried balance is bad, not good, especially into flat hourly earnings and flat-to-down work hours. Over all there's not a lot in here to write about; there certainly is no "resurgent boom" in consumer credit. market-ticker.org/akcs-www?post=221559 |
|


