|
|
Post by jeffolie on Jun 4, 2013 17:31:37 GMT -6
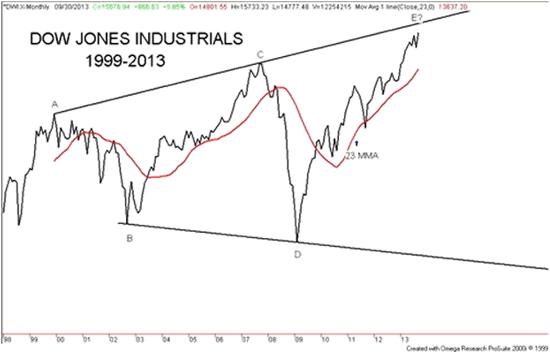
MEGAPHONE PATTERNA Megaphone pattern has higher highs .... the highs from 1999, 2007, today 2013-4 tops are building to the next leg down A Megaphone pattern has lower lows .... the lows from 2002, 2009, will be followed by a lower low than the 2009 lows the next leg down most likely will take 2-4 years from the next top which is currently now forming over a periods of months upto 1 year in my opinion =================================================================== Dow is 4% away from these 13 to 30-year resistance lines! Posted by Chris Kimble on 06/04/2013  blog.kimblechartingsolutions.com/wp-content/uploads/2013/06/dowpinchawayfrom30yearresistancejune4.jpg blog.kimblechartingsolutions.com/wp-content/uploads/2013/06/dowpinchawayfrom30yearresistancejune4.jpg A series of long-term resistance lines, ranging from 13 years to 31 years, drawn off of Monthly closing prices, meet at one price point at (1) in the chart above. You will notice in the inset chart last month the Dow touched one of these lines and stopped on a dime. These resistance lines intersect around the 16,000 level, around 4% above current prices. The line drawn off the 1982 lows took place when the Dow was trading below 1,000. From a long-term/30,000 foot view... the Dow is just a "Pinch away" from key resistance that has marked important emotional highs & lows of our past (1982 low, 1987 high, 2002 & 2003 low and 2011 high)! blog.kimblechartingsolutions.com/2013/06/dow-is-4-away-from-these-13-to-30-year-resistance-lines/
|
|
|
|
Post by jeffolie on Sept 21, 2013 12:43:31 GMT -6
my jeffolie view: the above megaphone chart will result in a collapse politically and economically into a new lower bottom below the D 2009 bottommost likely within 2 years into my predicted Greater Depression starting by 2016 
|
|
|
|
Post by jeffolie on Sept 30, 2013 11:31:17 GMT -6
my jeffolie view: the above megaphone chart will result in a collapse politically and economically into a new lower bottom below the D 2009 bottommost likely within 2 years into my predicted Greater Depression starting by 2016 The long term view of bull market tops featured in 2000, 2008 and my predicted current top in 2013 feature topping periods that appear to be high level consolidations for 3 months to over 1 year. my jeffolie view: the top is in as what I called Peak 2 of 3+ peaks where the Peak 3 and or more following peaks are bear market rallies, sucker rallies unlikely to exceed, take out the Peak 2 complex formed Sept 18 and the following week (different stock indexes peaked, topped on different times in this period). |
|
|
|
Post by jeffolie on Nov 3, 2013 12:20:26 GMT -6
11/3/2013 weekly DJIA chart update ... megaphone pattern topping  |
|
|
|
Post by jeffolie on Nov 3, 2013 16:47:32 GMT -6
|
|
|
|
Post by jeffolie on Nov 10, 2013 17:44:34 GMT -6
|
|