|
|
Post by jeffolie on Jul 5, 2013 12:58:46 GMT -6
Part-time worker ranks are growing, jobs report shows Though the nation added 195,000 jobs in June, the number of people working part-time rose sharply last month to 8.3 million. U.S. is only 'advanced economy' that does not require paid vacation More mothers report they want to work full time, survey finds July 5, 2013 Though Friday's job report showed the nation added nearly 200,000 jobs in June, the number of people working part-time due to slack economic conditions rose sharply. The number of people unable to find full-time work rose by 322,000 to 8.2 million last month. This figure had been decreasing from a peak of 9.1 million in mid-2009. The latest monthly payroll gains once again were led by restaurants and bars, which added a combined 52,000 jobs. The leisure and hospitality industry, as a whole, accounted for 75,000 of all the net job growth in June. These businesses on average offer fewer hours of work. The long-term implication of part-time work, economists said, is growing wage disparities and the risk of dampening consumer spending, a major driver of the economy. Part-time workers also are more likely to rely on state aid, such as food stamps, to make ends meet.
Michael Bernick, former California Employment Development Department director, has noted that various industries are increasingly relying on part-time workers and other contingent employees to save money. "As you have more and more costs associated with full-time workers in terms of healthcare or other costs, employers look for alternative ways to reduce costs," Bernick said in February. "One way is on-demand and part-time work." The increase isn't limited to industries that typically employ part-time workers, such as leisure and hospitality. Other sectors with strong job growth, such as professional and business services, have also seen a rise in part-time workers as employers aim to keep payroll costs down, Bernick said. Some economists say employers are also cutting worker hours to avoid paying for health insurance benefits ahead of the rollout of President Obama's healthcare law. Earlier this week, the administration delayed a key part of the Affordable Care Act: penalties on large employers who don't offer health coverage will not be imposed until 2015, a year after it was originally set to take effect. www.latimes.com/business/money/la-fi-mo-part-time-workers-20130705,0,3628730.story |
|
|
|
Post by jeffolie on Jul 5, 2013 15:47:25 GMT -6
Only 47% of Adults Have Full-Time JobThe release of the June Jobs' Report Friday was something of a relief for the markets. The Labor Department reported that the economy gained 195,000 jobs in June, which beat economists' expectations. The Department also reported that the economy gained 70,000 more jobs in April and May than it originally estimated. The report, however, also provides clear evidence that the the nation is splitting into two; only 47% of Americans have a full-time job and those who don't are finding it increasingly out of reach. Of the 144 million Americans employed last month, only 116 million were working full-time. Friday's report showed that 58.7% of the civilian adult population of 245 million was working last month. Only 47% of Americans, however, had a full-time job. The market's positive reaction to Friday's report is another sign of how far our economic expectations have fallen. If today the same proportion of Americans worked as just a decade ago, there would by almost 9 million more people working. Just in the last year, almost 2 million Americans have left the labor force. With a majority of the population not holding a full-time job, it isn't surprising that economic growth has been so weak.
In June, the number of Americans who wanted to work full-time, but were forced into part-time jobs because of the economy, jumped 352,000 to over 8 million.
The Jobs' Report is increasingly measuring only a part of the American economy. While Friday's report was better than expected, it only measures those who are working or actively looking for work. There is a growing number of Americans slipping through the cracks of the job market. www.breitbart.com/Big-Government/2013/07/05/only-47-americans-have-full-time-job
|
|
|
|
Post by jeffolie on Jul 5, 2013 16:05:44 GMT -6
July 05, 2013 Employment Report: More Hiring, Wages Up, Still Weak Labor Market by Bill McBride on 7/05/2013 The good news: This was the best first half for private employment gains since 1999. Also hourly and weekly wages increased 0.4% in June, and hourly wages are now up 2.2% over the last year (weekly wages are up 2.5% year-over-year).Some bad news: the employment-population ratio for the 25 to 54 year old group (prime working age) declined, the number of part time workers (for economic reasons) increased and U-6 (an alternative measure of labor underutilization) increased to 14.3%.
Some numbers: Total nonfarm employment is up 2.293 million over the last 12 months, and up 1.211 million so far in 2013 (a 2.42 million annual pace). Private employment is up 2.357 million over the last year, and up 1.234 million so far in 2013 (a 2.47 million annual pace). The following table shows the first and second half and full year changes in private employment since 1998. ... Of course public payrolls are continuing to shrink (four plus years of declining public payrolls now). Public employment was down 7 thousand in June (mostly at the Federal level), and public employment is down 64 thousand over the last year, and down 23 thousand so far in 2013 (a 46 thousand annual pace). A few more graphs ... Employment-Population Ratio, 25 to 54 years old 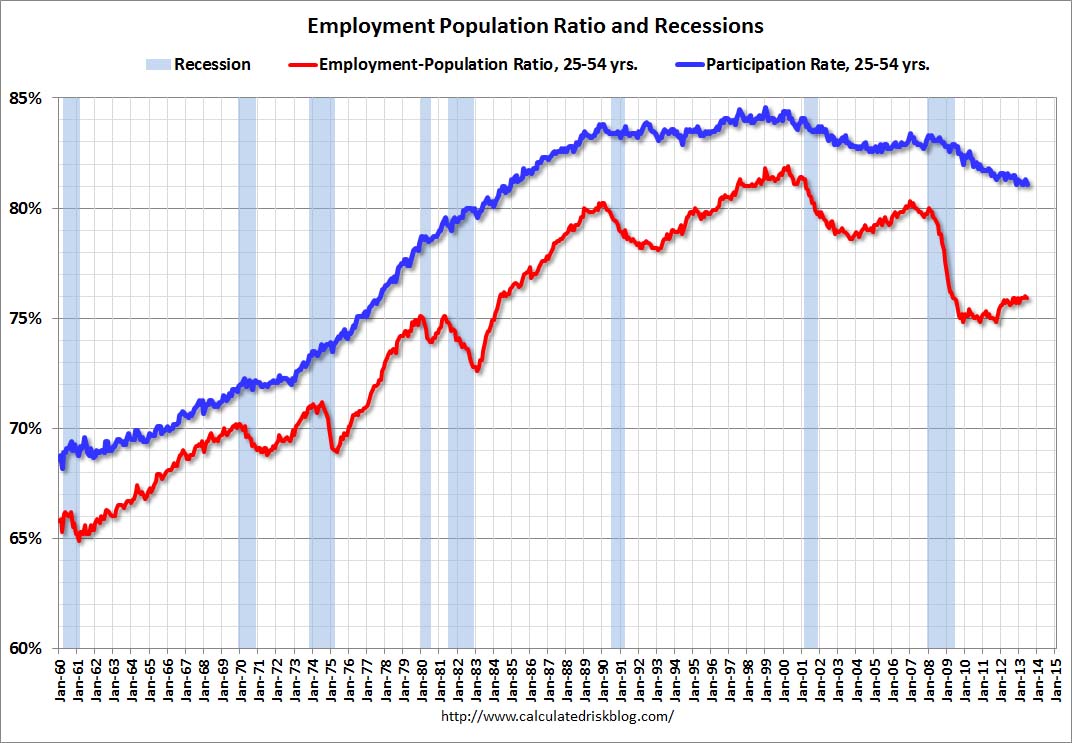 3.bp.blogspot.com/-_SNR3ODUARc/UdbahuuJqnI/AAAAAAAAa-s/lONwTt38-GY/s1600/EmployPop2554June2013.jpg 3.bp.blogspot.com/-_SNR3ODUARc/UdbahuuJqnI/AAAAAAAAa-s/lONwTt38-GY/s1600/EmployPop2554June2013.jpg Since the participation rate declined recently due to cyclical (recession) and demographic (aging population) reasons, an important graph is the employment-population ratio for the key working age group: 25 to 54 years old. In the earlier period the employment-population ratio for this group was trending up as women joined the labor force. The ratio has been mostly moving sideways since the early '90s, with ups and downs related to the business cycle. The ratio decreased to 75.9% in June from 76.0% in May. This ratio should probably move close to 80% as the economy recovers. The participation rate for this group also decreased in June to 81.1%. The decline in the participation rate for this age group is probably mostly due to economic weakness (as opposed to demographics) and this suggests the labor market is still very weak.  4.bp.blogspot.com/-xK2T8sbPnho/UdbalBV_pvI/AAAAAAAAa-0/nXCaihUu7CM/s1600/EmployRecAlignJune2013.jpg Percent Job Losses During Recessions 4.bp.blogspot.com/-xK2T8sbPnho/UdbalBV_pvI/AAAAAAAAa-0/nXCaihUu7CM/s1600/EmployRecAlignJune2013.jpg Percent Job Losses During Recessions This graph shows the job losses from the start of the employment recession, in percentage terms - this time aligned at maximum job losses. In the earlier post, the graph showed the job losses aligned at the start of the employment recession. This financial crisis recession was much deeper than other post WWII recessions, and the recovery has been slower (the recovery from the 2001 recession was slow too). However, if we compare to other financial crisis recoveries, this recovery has actually been better than most. 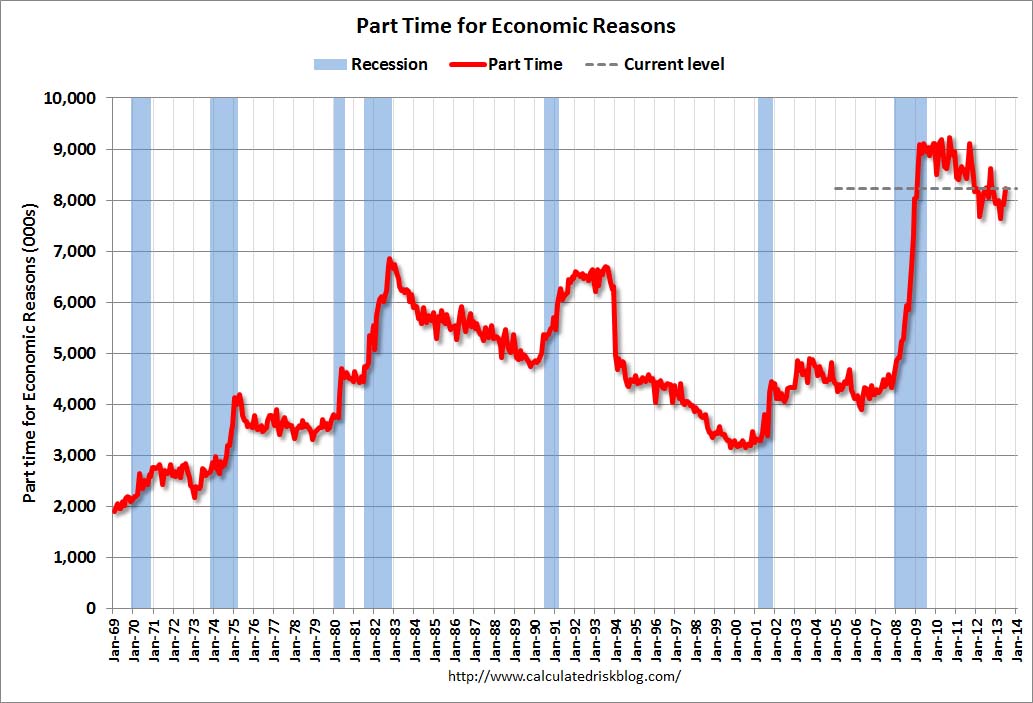 1.bp.blogspot.com/-rGc3T3lXT-c/Udban4yjYLI/AAAAAAAAa-8/6btBCdj9giw/s1600/PartTimeJune2013.jpgPart Time for Economic Reasons 1.bp.blogspot.com/-rGc3T3lXT-c/Udban4yjYLI/AAAAAAAAa-8/6btBCdj9giw/s1600/PartTimeJune2013.jpgPart Time for Economic Reasons From the BLS report: The number of persons employed part time for economic reasons (sometimes referred to as involuntary part-time workers) increased by 322,000 to 8.2 million in June. These individuals were working part time because their hours had been cut back or because they were unable to find a full-time job.
The number of part time workers increased in June to 8.226 million. These workers are included in the alternate measure of labor underutilization (U-6) that increased to 14.3% in June from 13.8% in May. 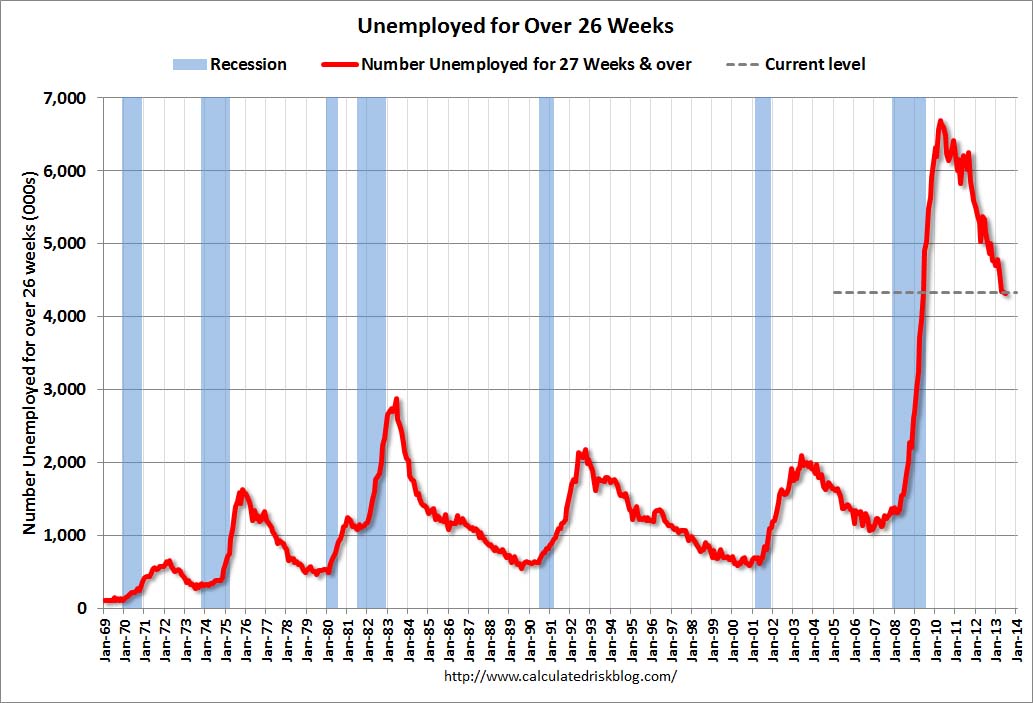 3.bp.blogspot.com/-p4FLr-Q_IHY/UdbarJmqexI/AAAAAAAAa_E/CvWqM6Ec97g/s1600/Unemploy26June2013.jpgUnemployed over 26 Weeks 3.bp.blogspot.com/-p4FLr-Q_IHY/UdbarJmqexI/AAAAAAAAa_E/CvWqM6Ec97g/s1600/Unemploy26June2013.jpgUnemployed over 26 Weeks This graph shows the number of workers unemployed for 27 weeks or more. According to the BLS, there are 4.328 million workers who have been unemployed for more than 26 weeks and still want a job. This was down slightly from 4.357 million in May. This is trending down, but is still very high. Long term unemployment remains one of the key labor problems in the US.
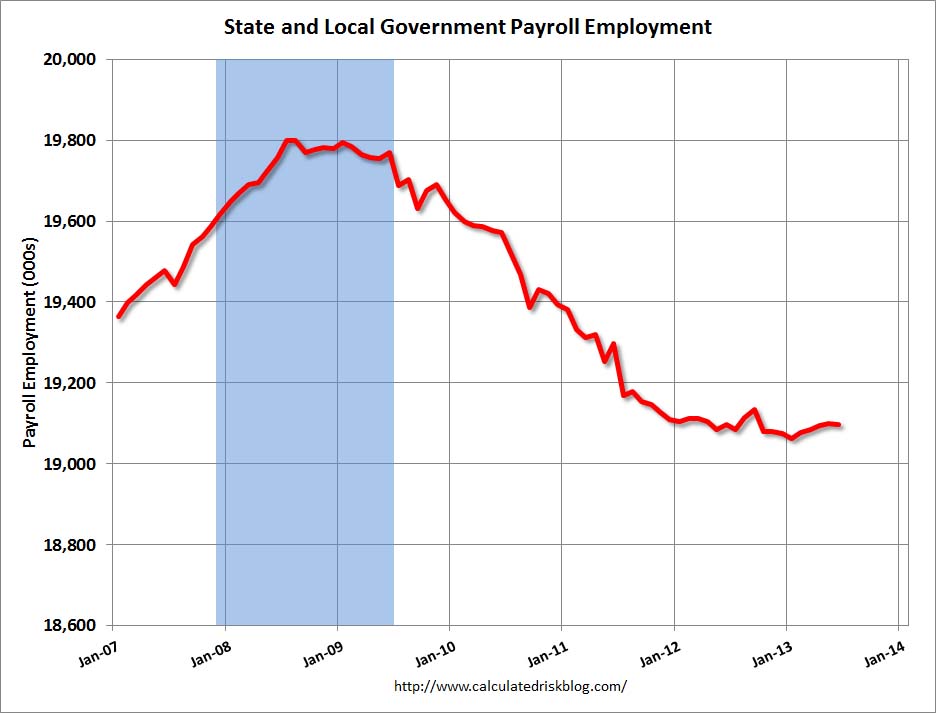 3.bp.blogspot.com/-Iie8XuTBeyw/UdbauGQYQwI/AAAAAAAAa_M/Ag872O66y_U/s1600/StateLocalJune2013.jpgState and Local Government 3.bp.blogspot.com/-Iie8XuTBeyw/UdbauGQYQwI/AAAAAAAAa_M/Ag872O66y_U/s1600/StateLocalJune2013.jpgState and Local GovernmentThis graph shows total state and government payroll employment since January 2007. State and local governments lost jobs for four straight years. (Note: Scale doesn't start at zero to better show the change.) In June 2013, state and local governments lost 2,000 jobs, and state and local employment is up 23 thousand so far in 2013. I think most of the state and local government layoffs are over. Of course total public employment declined again as the Federal government layoffs are ongoing - and with many more layoffs expected. Overall this was a solid report - especially with the upward revisions to April and May employment and the pickup in wage gains. But the labor market is still weak and millions of people are unemployed or underemployed. www.calculatedriskblog.com/ |
|
|
|
Post by unlawflcombatnt on Jul 6, 2013 11:05:47 GMT -6
July 05, 2013 Employment Report: More Hiring, Wages Up, Still Weak Labor Market by Bill McBride on 7/05/2013 The good news:...Also hourly and weekly wages increased 0.4% in June, and hourly wages are now up 2.2% over the last year (weekly wages are up 2.5% year-over-year). This statement is a gross distortion. It uses non-inflation-adjusted current dollar wages, instead of real wages. In fact, real hourly wages are up only 0.5% when comparing May 2012 with May 2013. But they're down from the previous year's level for Feb, March, & April. And "real" hourly wages are adjusted for the official, understated inflation rate concocted by the Government. But May 2013 real hourly wages are less than those in May 2011. And May 2013 real hourly wages are -2.0% less than May 2010. Median real household income declined by every measure. Unlike real average hourly wages (which is distorted by the increasing incomes of the highest earners) median real household income declined -0.1% from April 2013 to May 2013, and by -0.3% from May 2012 to May 2013. Below is a chart from AdvisorsPerspectives.com showing the longer-term trend in declining real median household income:  Median Real Household income is down -8.5% since 2008. Unless the number of households grew MORE than 8.5%, median household buying power is declining. It's impossible to have sustained GDP growth if median buying power is declining. Rich consumers cannot indefinitely offset the loss of buying power of the far more numerous non-affluent consumers. |
|
|
|
Post by jeffolie on Jul 6, 2013 12:30:26 GMT -6
July 05, 2013 Employment Report: More Hiring, Wages Up, Still Weak Labor Market by Bill McBride on 7/05/2013 The good news:...Also hourly and weekly wages increased 0.4% in June, and hourly wages are now up 2.2% over the last year (weekly wages are up 2.5% year-over-year). This statement is a gross distortion. It uses non-inflation-adjusted current dollar wages, instead of real wages. In fact, real hourly wages are up only 0.5% when comparing May 2012 with May 2013. But they're down from the previous year's level for Feb, March, & April. And "real" hourly wages are adjusted for the official, understated inflation rate concocted by the Government. But May 2013 real hourly wages are less than those in May 2011. And May 2013 real hourly wages are -2.0% less than May 2010. Median real household income declined by every measure. Unlike real average hourly wages (which is distorted by the increasing incomes of the highest earners) median real household income declined -0.1% from April 2013 to May 2013, and by -0.3% from May 2012 to May 2013. Below is a chart from AdvisorsPerspectives.com showing the longer-term trend in declining real median household income:  today's most common American struggles to maintain while suffering a 'regular depression' of real wages. my jeffolie view: the economy and culture of America are slowly dying ... worse will come with a change to the status quo leading into a significant decline by 2016 as the START of a new BOTTOMING AREA, aka a new Great Depression ... today's most common American struggles to maintain while suffering a 'regular depression' as the rich grow richer from skyrocketing stocks and a housing bubble ... both peaking |
|
|
|
Post by jeffolie on Jul 6, 2013 12:46:48 GMT -6
from: bart's blog Update 7/5/2013 - •U3 official unemployment unchanged at 7.6% • U6 under-unemployment rate up to 14.3% from 13.8% • U7 reconstructed unemployment rate up to 21.9% from 21.5% •Non farm payroll S.A., up 195,000 (165,000 expected) •Birth death model S.A., added 129,000. •Household survey, up 160,000 • Unemployment total, up to 12.248 million from 11.302 million previous month. •Employed part time for economic reasons, slack work, business conditions; up 352 thousand from previous month. •Employed part time as percentage of total non farm payroll, up to 20.5% from 20.3%. •Participation up 1/10 to 63.5% •Overall, not as good a report as it appears from the non farm payroll rate increase. blog.nowandfutures.com/index.html |
|
|
|
Post by unlawflcombatnt on Jul 6, 2013 12:48:36 GMT -6
The BLS chart on Median Real Weekly Wages is informative in more than 1 way. The most obvious is the -1.2% year-over-year quarterly decline from Q1 2012 to Q1 2013. Also of interest, however, is the classification of the workers used. This chart uses Full-Time workers only in its calculation. That number was only 103,972,000. Out of a population of over 310,000,000. That's less than 1/3rd of the total population. That's only 42% of the 245 million Americans age 16 & over. And this 103.9 million is a far cry from the 143.8 million total employment number from the Household Survey. And this Full-Time employment number is still -4.4 million less than the 108.178 million for the 4th quarter of 2007 (when we had 12 million less potential workers at 233 million). Little wonder that real median wages are down. The labor supply has increased by +12 million since 2007, while the demonstrable demand has decreased by -4.4 million. |
|
|
|
Post by unlawflcombatnt on Jul 13, 2013 12:24:30 GMT -6
In case this gets lost in the shuffle, I just want to make sure I repost the Median Real Family Income chart from AdvisorsPerspectives: |
|

