|
|
Post by unlawflcombatnt on Aug 30, 2007 3:25:37 GMT -6
Below is a graph of the Japanese housing bubble, showing how it rose, and then fell back to baseline. 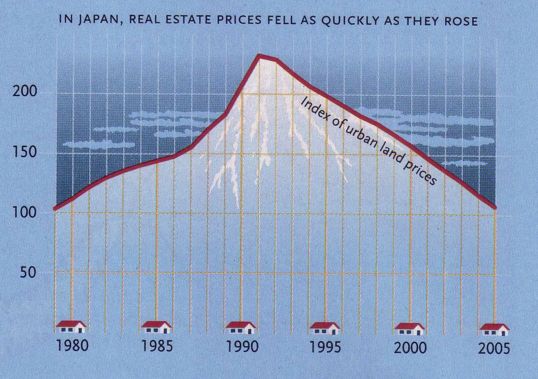 This is likely the same course the current U.S.Housing Bubble will take. |
|
|
|
Post by jeffolie on Aug 30, 2007 11:42:11 GMT -6
Notice how slowly house prices decline. Real estate prices are 'sticky'. There is a symestry to the Japanese decline. If that holds up in the US, then we may see a quick 5 year unwind as we had a quick 5 year rise.
|
|

