
Post by jeffolie on Feb 18, 2013 9:48:37 GMT -6
China must sell to America even more so now
my jeffolie view: POLITICS MATTERS, America remains the only SuperPower both economically and politically as it slowly struggles with split govt, gridlock in politics and economics. Our FED asset bubble building higher stock markets and a sustained modest housing price surge sustains the Type 1 consumer thrive buying of high ticket items such as new cars while the rest, Type 2 WalMart consumers struggle with lower paychecks from a 2% payroll tax increase, jobs fears and looming govt spending cuts. China must sell to America even more so now that the rest of the world struggles with declining economies.
February 15, 2013
2012 Export Growth by Country; China and US at Top of List; World Trade Slowdown; Rebalancing at Glacial Pace
Inquiring minds are looking at charts from the New York Times that show U.S. Trade in 2012 Outpaced Many Other Countries.
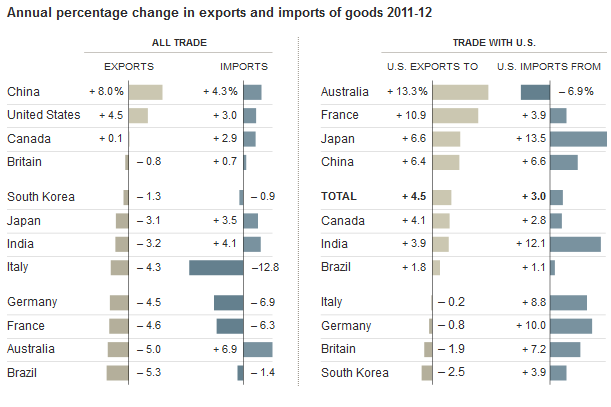
In 2012, United States exports of goods rose 4.5 percent from 2011, a faster rate of growth than that of 10 other major countries but well below the growth rate of Chinese exports. American imports rose 3 percent, but the trade deficit in goods was virtually unchanged. In six of the last seven years, the growth in American exports outpaced that of imports. The United States gained in exports despite declines in trade with some major European trading partners.
Global Export Growth
3.bp.blogspot.com/-VwvgysCCXCA/UR7jWm9VvaI/AAAAAAAAU5E/iYvrdbQqA-Y/s1600/global+export+growth.png
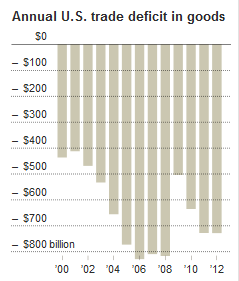
Export Growth Perspective
A little perspective helps as the trade deficit chart from the New York Times shows.
1.bp.blogspot.com/-FPDF2OPsbag/UR7kyVf-5nI/AAAAAAAAU5Q/EXluSWlFtTI/s1600/US+Trade+Deficit.png
The US had a trade deficit over $700 billion in 2011 and 2012. That is down from $800 Billion+ between 2006 and 2008 but it is certainly nothing to brag about.
World Trade Slowdown
Please consider In World Trade Data, Signs of a Slowdown, a related article by New York Times columnist Floyd Norris.
WORLD trade slowed last year, as major countries like Japan and Germany shipped exports that were worth less than those in 2011. The United States bucked the trend to some extent, but the 4.5 percent increase in exports was far smaller than the 15.8 percent jump in 2011.
Import totals can provide an indication of economic woes, as declining incomes cause consumers to buy less, including fewer items from abroad. Imports fell in Germany, France and particularly Italy. This week, the European Union reported that the euro zone economy declined in the fourth quarter — the third consecutive fall. Germany’s economy, which had been growing slowly, also shrank.
Exports plunged in all countries during the crisis, but the trends since then have varied. German exports in 2012 were 3 percent lower than in 2008, while French exports were off almost 8 percent. Japanese and British exports were about 2 percent higher. The United States, by contrast, reported exports of goods in 2012 that were up 20 percent from 2008, and Brazilian exports were 23 percent higher.
Those gains pale next to those of developing Asian economies. South Korean exports in 2012 were 30 percent higher than in 2008, while China bolstered its shipments by 43 percent. Indian exports were 50 percent higher.
Rebalancing at Glacial Pace
To the extent there is any global rebalancing (if at all), the pace is certainly glacial. In regards to Europe in particular, I see no evidence at all. For details, please see ...
•German Trade Surplus Hits Five-Year High; Rebalancing the Wrong Way
•Europe à l’Hollandaise; Socialists Who Wrecked France, Demand the Same for Rest of Eurozone
•Wealthy French Eye Belgian Tax Breaks (Everyone in France Should Do the Same)
•Top 1% Received 121% of Income Gains During the Recovery, Bottom 99% Lose .4%; How, Why, Solutions
globaleconomicanalysis.blogspot.com/2013/02/2012-export-growth-by-country-china-and.html
===================================================
February 18, 2013
LA area Port Traffic in January
by Bill McBride on 2/18/2013
I've been following port traffic for some time. Container traffic gives us an idea about the volume of goods being exported and imported - and possibly some hints about the trade report for January. LA area ports handle about 40% of the nation's container port traffic.
The following graphs are for inbound and outbound traffic at the ports of Los Angeles and Long Beach in TEUs (TEUs: 20-foot equivalent units or 20-foot-long cargo container).
To remove the strong seasonal component for inbound traffic, the first graph shows the rolling 12 month average.

3.bp.blogspot.com/-zM4Vt4mmZnI/USI8LQLuJxI/AAAAAAAAYr0/oWCgyFeunLc/s1600/PortTrafficRollingJan2013.jpg
On a rolling 12 month basis, inbound traffic was up slightly in January, and outbound traffic down slightly, compared to the rolling 12 months ending in December.
In general, inbound traffic has been increasing slightly recently, and outbound traffic has been mostly moving sideways.

4.bp.blogspot.com/-d7SrwnPcGh8/USI8JNcbLQI/AAAAAAAAYrs/RvQNY056YT0/s1600/PortTrafficJan2013.jpg
The 2nd graph is the monthly data (with a strong seasonal pattern for imports).
Usually imports peak in the July to October period as retailers import goods for the Christmas holiday, and then decline sharply and bottom in February or March.
For the month of January, loaded outbound traffic was up slightly compared to January 2012, and loaded inbound traffic was up 4% compared to January 2012.
This suggest a slight increase in the trade deficit with Asia for January.
www.calculatedriskblog.com/2013/02/la-area-port-traffic-in-january.html
=================================
World Plunges Into Recession
By Dwaine van Vuuren 02/15/2013
With the disappointing initial GDP releases for Q42012 from Europe out, the “world” as defined by 41 OECD countries across the globe, has plunged into recession. We define “recession” through two alternative definitions for our comparison, either the presence of a single negative quarter-on-quarter growth or the more traditional two consecutive negative quarterly growths. Whichever way you look at it, the number of countries in expansion plunged dramatically between 3Q2013 and 4Q2012 as shown below:

www.financialsense.com/sites/default/files/users/u728/images/2013/oecd-countries-expansion-1960-2012.jpg
Now this is a diffusion index, with each country receiving equal weightings, and so it appears that 60% seems to be a viable threshold for the definition of “global recession” using the single-quarter definition (black) and 70% is probably the appropriate threshold for the 2-quarter definition (blue).
Countries in “recession” for the 18 countries we have data for so far in 4Q are: Austria, Belgium*, Czech Republic*, France, Germany, Hungary*, Italy*, Japan*, Netherlands*, Portugal*, Spain*, Greece*, U.S and UK. Countries with 2 consecutive negative q-on-q growths are highlighted with “*” next to their names.
We should add that 4Q2012 GDP figures are preliminary releases, subject to revisions (we expect the US to revise upward) and we also only have data for 18 countries for the fourth quarter so far, and a heavy sprinkling of EU-based entities to boot that could be skewing the numbers to the downside. As the figures roll in during the course of the month/s we will update clients accordingly.
It is clear the U.S is faring far better than most, but one has to question how long she can remain above water with the drag of her economic peers weighing upon her economy. Whilst most long leading indicators for the US are pointing strongly up, the co-incident U.S data is on the brink. We will be watching the two co-incident stalwarts - NBER Recession Model and the GDP/GDI Recession Models very closely indeed.
www.financialsense.com/contributors/dwaine-van-vuuren/world-plunges-into-recession-in-q42012
my jeffolie view: POLITICS MATTERS, America remains the only SuperPower both economically and politically as it slowly struggles with split govt, gridlock in politics and economics. Our FED asset bubble building higher stock markets and a sustained modest housing price surge sustains the Type 1 consumer thrive buying of high ticket items such as new cars while the rest, Type 2 WalMart consumers struggle with lower paychecks from a 2% payroll tax increase, jobs fears and looming govt spending cuts. China must sell to America even more so now that the rest of the world struggles with declining economies.
February 15, 2013
2012 Export Growth by Country; China and US at Top of List; World Trade Slowdown; Rebalancing at Glacial Pace
Inquiring minds are looking at charts from the New York Times that show U.S. Trade in 2012 Outpaced Many Other Countries.
In 2012, United States exports of goods rose 4.5 percent from 2011, a faster rate of growth than that of 10 other major countries but well below the growth rate of Chinese exports. American imports rose 3 percent, but the trade deficit in goods was virtually unchanged. In six of the last seven years, the growth in American exports outpaced that of imports. The United States gained in exports despite declines in trade with some major European trading partners.
Global Export Growth
3.bp.blogspot.com/-VwvgysCCXCA/UR7jWm9VvaI/AAAAAAAAU5E/iYvrdbQqA-Y/s1600/global+export+growth.png
Export Growth Perspective
A little perspective helps as the trade deficit chart from the New York Times shows.
1.bp.blogspot.com/-FPDF2OPsbag/UR7kyVf-5nI/AAAAAAAAU5Q/EXluSWlFtTI/s1600/US+Trade+Deficit.png
The US had a trade deficit over $700 billion in 2011 and 2012. That is down from $800 Billion+ between 2006 and 2008 but it is certainly nothing to brag about.
World Trade Slowdown
Please consider In World Trade Data, Signs of a Slowdown, a related article by New York Times columnist Floyd Norris.
WORLD trade slowed last year, as major countries like Japan and Germany shipped exports that were worth less than those in 2011. The United States bucked the trend to some extent, but the 4.5 percent increase in exports was far smaller than the 15.8 percent jump in 2011.
Import totals can provide an indication of economic woes, as declining incomes cause consumers to buy less, including fewer items from abroad. Imports fell in Germany, France and particularly Italy. This week, the European Union reported that the euro zone economy declined in the fourth quarter — the third consecutive fall. Germany’s economy, which had been growing slowly, also shrank.
Exports plunged in all countries during the crisis, but the trends since then have varied. German exports in 2012 were 3 percent lower than in 2008, while French exports were off almost 8 percent. Japanese and British exports were about 2 percent higher. The United States, by contrast, reported exports of goods in 2012 that were up 20 percent from 2008, and Brazilian exports were 23 percent higher.
Those gains pale next to those of developing Asian economies. South Korean exports in 2012 were 30 percent higher than in 2008, while China bolstered its shipments by 43 percent. Indian exports were 50 percent higher.
Rebalancing at Glacial Pace
To the extent there is any global rebalancing (if at all), the pace is certainly glacial. In regards to Europe in particular, I see no evidence at all. For details, please see ...
•German Trade Surplus Hits Five-Year High; Rebalancing the Wrong Way
•Europe à l’Hollandaise; Socialists Who Wrecked France, Demand the Same for Rest of Eurozone
•Wealthy French Eye Belgian Tax Breaks (Everyone in France Should Do the Same)
•Top 1% Received 121% of Income Gains During the Recovery, Bottom 99% Lose .4%; How, Why, Solutions
globaleconomicanalysis.blogspot.com/2013/02/2012-export-growth-by-country-china-and.html
===================================================
February 18, 2013
LA area Port Traffic in January
by Bill McBride on 2/18/2013
I've been following port traffic for some time. Container traffic gives us an idea about the volume of goods being exported and imported - and possibly some hints about the trade report for January. LA area ports handle about 40% of the nation's container port traffic.
The following graphs are for inbound and outbound traffic at the ports of Los Angeles and Long Beach in TEUs (TEUs: 20-foot equivalent units or 20-foot-long cargo container).
To remove the strong seasonal component for inbound traffic, the first graph shows the rolling 12 month average.
3.bp.blogspot.com/-zM4Vt4mmZnI/USI8LQLuJxI/AAAAAAAAYr0/oWCgyFeunLc/s1600/PortTrafficRollingJan2013.jpg
On a rolling 12 month basis, inbound traffic was up slightly in January, and outbound traffic down slightly, compared to the rolling 12 months ending in December.
In general, inbound traffic has been increasing slightly recently, and outbound traffic has been mostly moving sideways.
4.bp.blogspot.com/-d7SrwnPcGh8/USI8JNcbLQI/AAAAAAAAYrs/RvQNY056YT0/s1600/PortTrafficJan2013.jpg
The 2nd graph is the monthly data (with a strong seasonal pattern for imports).
Usually imports peak in the July to October period as retailers import goods for the Christmas holiday, and then decline sharply and bottom in February or March.
For the month of January, loaded outbound traffic was up slightly compared to January 2012, and loaded inbound traffic was up 4% compared to January 2012.
This suggest a slight increase in the trade deficit with Asia for January.
www.calculatedriskblog.com/2013/02/la-area-port-traffic-in-january.html
=================================
World Plunges Into Recession
By Dwaine van Vuuren 02/15/2013
With the disappointing initial GDP releases for Q42012 from Europe out, the “world” as defined by 41 OECD countries across the globe, has plunged into recession. We define “recession” through two alternative definitions for our comparison, either the presence of a single negative quarter-on-quarter growth or the more traditional two consecutive negative quarterly growths. Whichever way you look at it, the number of countries in expansion plunged dramatically between 3Q2013 and 4Q2012 as shown below:
www.financialsense.com/sites/default/files/users/u728/images/2013/oecd-countries-expansion-1960-2012.jpg
Now this is a diffusion index, with each country receiving equal weightings, and so it appears that 60% seems to be a viable threshold for the definition of “global recession” using the single-quarter definition (black) and 70% is probably the appropriate threshold for the 2-quarter definition (blue).
Countries in “recession” for the 18 countries we have data for so far in 4Q are: Austria, Belgium*, Czech Republic*, France, Germany, Hungary*, Italy*, Japan*, Netherlands*, Portugal*, Spain*, Greece*, U.S and UK. Countries with 2 consecutive negative q-on-q growths are highlighted with “*” next to their names.
We should add that 4Q2012 GDP figures are preliminary releases, subject to revisions (we expect the US to revise upward) and we also only have data for 18 countries for the fourth quarter so far, and a heavy sprinkling of EU-based entities to boot that could be skewing the numbers to the downside. As the figures roll in during the course of the month/s we will update clients accordingly.
It is clear the U.S is faring far better than most, but one has to question how long she can remain above water with the drag of her economic peers weighing upon her economy. Whilst most long leading indicators for the US are pointing strongly up, the co-incident U.S data is on the brink. We will be watching the two co-incident stalwarts - NBER Recession Model and the GDP/GDI Recession Models very closely indeed.
www.financialsense.com/contributors/dwaine-van-vuuren/world-plunges-into-recession-in-q42012