
Post by jeffolie on Mar 11, 2013 9:59:09 GMT -6
Demographic Nightmare & Recession
What would it take to reverse the demographic nightmare in America?
my jeffolie view: Based on the rhyme of history: after a serious, significant bottoming period, then a popular war begets a new population growth and economic growth period ... most likely the new 30+ years of growth and demographic shift would happen about 2026 [SWAG].
====================================
March 11, 2013
1.bp.blogspot.com/-252KIGfKxss/UT2jKQSahJI/AAAAAAAAVXw/De68DLQ4RIs/s1600/employed+to+Not+Working+Ratio3.png
Demographic Nightmare; Recession Through Recovery in Pictures
Please consider a table of various employment statistics for February of each year between 2008 and 2013.
In The Last 5 Years
•The Civilian Institutional Population Rose 9.9 Million
•The Labor Force Rose .9 Million
•Those Not in the Labor Force Rose 9.8 Million
•Employment Fell by 2.3 Million
•Full-Time Employment Fell by 5.3 Million
•Part-Time Employment Rose by .9 Million
•Unemployment Rose by 4.5 Million
•Food Stamp Usage Rose by 20.3 Million
Non-Workers to Workers
Let's consider the ratio of workers to non-workers. Workers are those employed, non-workers are everyone else (the unemployed + those not in the labor force).
•In the last five years, the number of non-workers rose by 14.3 million while the number of workers fell by 5.3 million.
•In 2008 there were 144.6 million workers supporting 88.3 million not working.
•There are now roughly 142.2 million workers supporting 102.6 million not working.
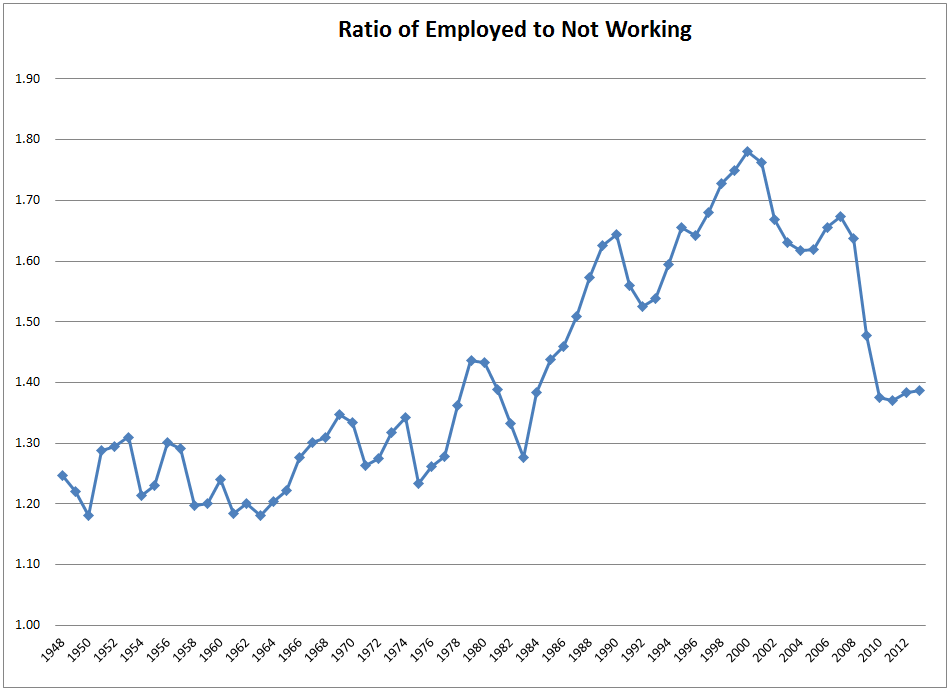
Ratio of Employed to Not Working
Reader Tim Wallace put together a nice chart showing the ratio of those employed to those not working.
Demographic Nightmare
In the year 2000, there were 1.78 workers for every non-worker. Now there are only 1.39 workers for every non-worker. Meanwhile, food stamp usage is up from 17.2 million to 46.6 million, and medical costs are soaring.
Wallace comments "the economic burden on the 1.39 is only going to increase unless spending is put under control and the ratio moves back to a higher average number."
Things looked OK as long as the ratio of workers to non-workers was rising. It was a demographic "boomer-bubble" illusion fueled by the entry of women taking jobs.
The ratio of workers to non-workers is now falling, as are real wages. Meanwhile, part-time employment is rising, and costs as well as promises have soared.
The only realistic way to solve this problem is to cut expenses. That means a cut in medical benefits coupled with a hike in the retirement age.
globaleconomicanalysis.blogspot.com/2013/03/recession-through-recovery-employment.html
What would it take to reverse the demographic nightmare in America?
my jeffolie view: Based on the rhyme of history: after a serious, significant bottoming period, then a popular war begets a new population growth and economic growth period ... most likely the new 30+ years of growth and demographic shift would happen about 2026 [SWAG].
====================================
March 11, 2013
1.bp.blogspot.com/-252KIGfKxss/UT2jKQSahJI/AAAAAAAAVXw/De68DLQ4RIs/s1600/employed+to+Not+Working+Ratio3.png
Demographic Nightmare; Recession Through Recovery in Pictures
Please consider a table of various employment statistics for February of each year between 2008 and 2013.
In The Last 5 Years
•The Civilian Institutional Population Rose 9.9 Million
•The Labor Force Rose .9 Million
•Those Not in the Labor Force Rose 9.8 Million
•Employment Fell by 2.3 Million
•Full-Time Employment Fell by 5.3 Million
•Part-Time Employment Rose by .9 Million
•Unemployment Rose by 4.5 Million
•Food Stamp Usage Rose by 20.3 Million
Non-Workers to Workers
Let's consider the ratio of workers to non-workers. Workers are those employed, non-workers are everyone else (the unemployed + those not in the labor force).
•In the last five years, the number of non-workers rose by 14.3 million while the number of workers fell by 5.3 million.
•In 2008 there were 144.6 million workers supporting 88.3 million not working.
•There are now roughly 142.2 million workers supporting 102.6 million not working.
Ratio of Employed to Not Working
Reader Tim Wallace put together a nice chart showing the ratio of those employed to those not working.
Demographic Nightmare
In the year 2000, there were 1.78 workers for every non-worker. Now there are only 1.39 workers for every non-worker. Meanwhile, food stamp usage is up from 17.2 million to 46.6 million, and medical costs are soaring.
Wallace comments "the economic burden on the 1.39 is only going to increase unless spending is put under control and the ratio moves back to a higher average number."
Things looked OK as long as the ratio of workers to non-workers was rising. It was a demographic "boomer-bubble" illusion fueled by the entry of women taking jobs.
The ratio of workers to non-workers is now falling, as are real wages. Meanwhile, part-time employment is rising, and costs as well as promises have soared.
The only realistic way to solve this problem is to cut expenses. That means a cut in medical benefits coupled with a hike in the retirement age.
globaleconomicanalysis.blogspot.com/2013/03/recession-through-recovery-employment.html


