

Post by unlawflcombatnt on Jul 6, 2007 14:28:52 GMT -6
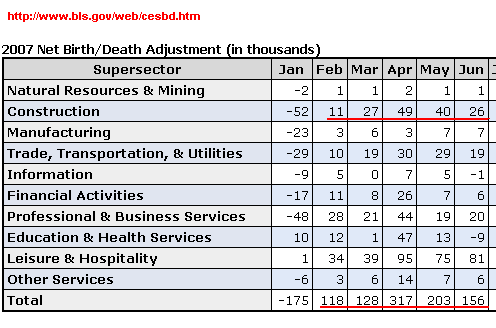
Today's Payroll Employment report is another falsely optimistic concoction put out by the Federal government. Today's 132,000 monthly job creation is 18,000 less than the 150,000 needed to keep up with labor force growth. More interesting is that 156,000 jobs were added to this total number by the infamous business "birth/death" concoction. These are "imputed" jobs, not jobs that were actually counted. In other words, the actual number of "counted" jobs was 132K - 156K, which equals a -24K jobs in June. Thus, the number of payroll jobs that were actually counted in June declined by 24K in June. Below is a chart of the BLS information.
The longer-term job growth is also obscured by today's concocted employment report. Total employment has only increased 214K for the first 6 months of 2007, from 145.926 million in December 2006 to 146.140 million at the end of June. This is an average of only 36,000/month. At this rate, the annual employment increase would be only 432,000 for the entire year.
In comparison, total employment increased 1.6 million during the 1st 6 months of 2006. This means there have been 1.172 million less jobs created during the 1st 6 months of 2007 than in 2006.
Real wages have also declined during the 1st 5 months of 2007, both in hourly and weekly terms.(June's real wages aren't available yet from the BLS, since the CPI for June hasn't come out yet.) May's real hourly wage was $0.10 less than in December of 2006, declining from $8.36/hour (in inflation-adjusted 1982 dollars) in December to $8.26/hour in May.
Average weekly wages showed a similar decline, falling -$3.90/week--from $283.25/week in December 2006, down to $279.35/week in May 2007 (in 1982 dollars).
Calculating the aggregate wage increase is also very telling. Multiplying December's Total Employment (145.926 million) X December's weekly wage ($283.25) X 26 weeks (for the 1st 6 months of 2007) = $1,074,672 million, or $1,074.7 billion.
Since June real wages are not yet available (due to the CPI not being out yet), the same calculation will be done with May's weekly real wages of $279.35. Multiplying June's Total Employment (146.140 million) X May's $279.35/week X 26 weeks = $1,061,429 million, or
$1,061.4 billion.
June's $1,061.4 billion - December's $1,074.7 billion = -$13.3 billion
(However, this is in 1982 dollars, not 'chained 2000' dollars, which is how GDP is calculated)
A crude method for converting 1982 dollars into 'chained 2000' dollars would be to multiply the 1982 dollar amount by the change in the CPI from 1982 to 2000. Such a calculation would go as follows:
(2000 CPI of 172 divided by 1982 CPI of 100) X -13.3 billion = -$23 billion.
Thus aggregate real wages, in chained 2000 dollars,
have declined roughly -$23 billion during 2007. For reference, the 1st quarter GDP increase was only $19 billion. Thus, the aggregate wage decline for 2007 was greater than the 1st quarter GDP increase.
This also means that any increase in consumer spending has been financed by non-wage income, borrowing, or sale of assets.
Is there anyone who thinks this is a sustainable course? Can the economy continue "growing" when the main funding source of consumer spending is decreasing?


