

Post by unlawflcombatnt on Jul 3, 2006 15:24:05 GMT -6
It's worthwhile to point out again how previous months' overestimates have been revised downward in current releases. In this case, the downward revisions are to Residential Construction figures, as well as overall construction figures.
Once again, the previous 4 months' original numbers for Residential Construction were all higher than they are currently listed. Below are partial copies of charts from Briefing.com. The top chart was copied down from Briefing.com on 5/31/06. The middle chart (the "preliminary" chart) was copied down on 7/2/06. The bottom chart is from 7/3/06. It was copied down less than 24 hours later. Not only is the actual overall Construction Spending much lower than previous estimates, but "Residential" Construction Spending is much lower as well. Below is a modified, partial copy of the 3 charts, showing the difference between the previously reported information (and overall construction estimate) and today's reported "actual" numbers.
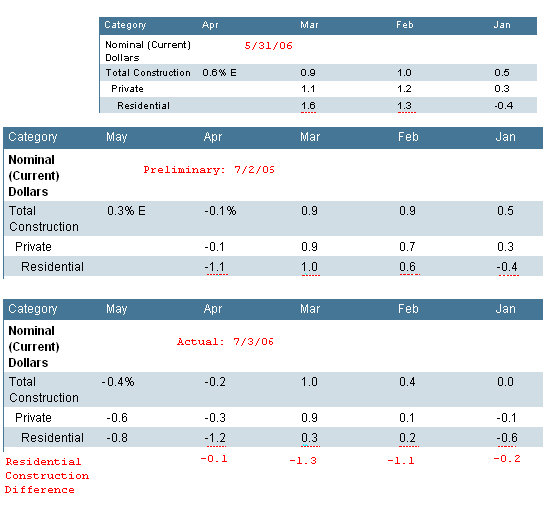
Today's Construction Spending from Briefing.com figures can be found at Construction Spending (Also notice how they left out the "-" sign from today's reported total Construction Spending change of -0.4%. At least initially, it was posted as 0.4%, instead of -0.4%.)
Note that overall Construction Spending declined 0.4%, instead of increasing 0.3% as was originally estimated.
Note how April's Residential construction was revised downward
from a change of -1.1% to -1.2%
(a change of -0.1%)
Note how March's original increase of +1.6% was downwardly revised to +0.3%
(a change of -1.3%.)
Note how February was downwardly revised from +1.3% to +0.2%
(a change of -1.1%.)
Note how January's original -0.4% was downwardly revised to -0.6%
(a change of -0.2%).
The sum total of the downward revisions since January 2006 is -2.7%.
How is it that all previous numbers have been revised downward, while none have been revised upward? Does anyone really believe these are
"honest" mis-estimations? If they were "honest" errors, how is it that
all previously posted statistics were too high initially? Shouldn't some of these "honest" mis-calculations have been too low?
Once again, the previous 4 months' original numbers for Residential Construction were all higher than they are currently listed. Below are partial copies of charts from Briefing.com. The top chart was copied down from Briefing.com on 5/31/06. The middle chart (the "preliminary" chart) was copied down on 7/2/06. The bottom chart is from 7/3/06. It was copied down less than 24 hours later. Not only is the actual overall Construction Spending much lower than previous estimates, but "Residential" Construction Spending is much lower as well. Below is a modified, partial copy of the 3 charts, showing the difference between the previously reported information (and overall construction estimate) and today's reported "actual" numbers.
Today's Construction Spending from Briefing.com figures can be found at Construction Spending (Also notice how they left out the "-" sign from today's reported total Construction Spending change of -0.4%. At least initially, it was posted as 0.4%, instead of -0.4%.)
Note that overall Construction Spending declined 0.4%, instead of increasing 0.3% as was originally estimated.
Note how April's Residential construction was revised downward
from a change of -1.1% to -1.2%
(a change of -0.1%)
Note how March's original increase of +1.6% was downwardly revised to +0.3%
(a change of -1.3%.)
Note how February was downwardly revised from +1.3% to +0.2%
(a change of -1.1%.)
Note how January's original -0.4% was downwardly revised to -0.6%
(a change of -0.2%).
The sum total of the downward revisions since January 2006 is -2.7%.
How is it that all previous numbers have been revised downward, while none have been revised upward? Does anyone really believe these are
"honest" mis-estimations? If they were "honest" errors, how is it that
all previously posted statistics were too high initially? Shouldn't some of these "honest" mis-calculations have been too low?